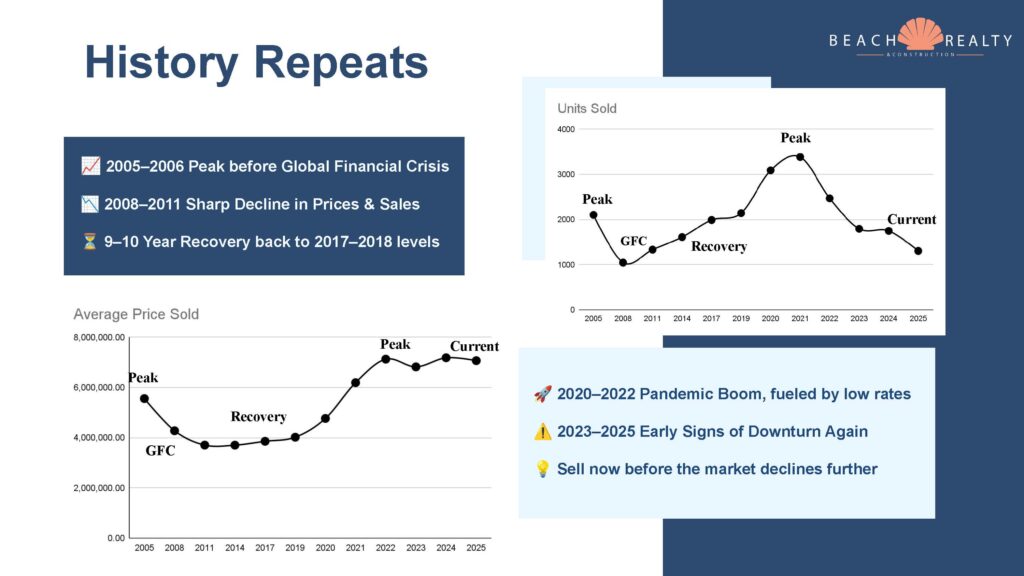
Every Cycle Tells the Same Story
In 2005 and 2006, we hit a major peak before the 2008 financial crisis struck. From 2008 through 2011, prices and sales activity fell sharply — and it took nearly a full decade to recover. Then came another boom from 2020 to 2022, fueled by record-low interest rates and intense buyer demand. Now, as we move through 2023–2025, we’re beginning to see familiar signs: softening demand, rising inventory, and leveling prices.
That pattern should sound familiar — because it’s the start of the next cycle.
The Psychology of the Market
We all remember that subprime mortgages triggered the 2008 crash. What’s happening now is broader — economists call it the “everything bubble.” Once bubbles begin to deflate, it typically takes four to five years to reach the bottom. The reason? Seller denial. Sellers hold out, convinced prices will bounce back, while buyers wait for better deals. In a resort market like ours, where neither side must move, both dig in.
Sellers say, “I’ll just keep it for now.” Buyers say, “I’ll wait until prices drop.”
And who wins the waiting game? Buyers do — every time.
Key Takeaways
• The last downturn took nearly a decade to recover.
• We’re seeing early signs of another correction.
• Selling before the decline accelerates protects your equity.
• Waiting could mean competing with more sellers at lower prices — and watching your gains fade over
years, not months.
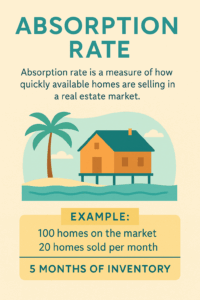 Absorption rate is a key real estate metric that shows how quickly available homes are selling in a specific market.
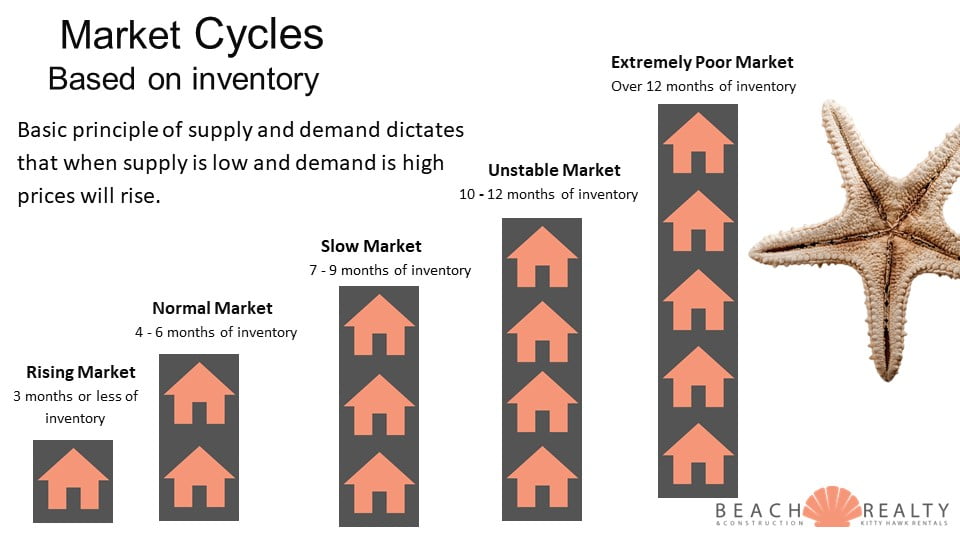
 As we approach the second half of the year, it’s important to notice the little shifts happening along the way. Remember, real estate markets don’t crash overnight. It happens slowly at first, then all of a sudden. We are in the slowly at first phase.
 What a difference a year makes! Long story short, there are some BIG moves that are happening. I’ve talked before about algorithmic decay. This chart here is exactly that! Little, by little, by little, then bang. That’s how markets change. Tale as old as time, song as old as rhyme, it’s almost as good as a crystal ball.
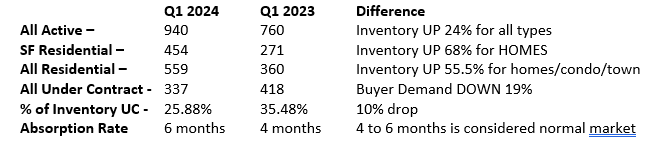
 A lot of agents will do presentations on how they came up with a price for your home. It is a task that does require some skill. The challenge of course is getting the seller to agree to the pricing suggestions.
 Mid-year is upon us and not much has changed since the last report. I did notice an interesting trend regarding CASH in our marketplace. Here’s the deal. There have been 136 home sales in Duck and Corolla since January.
 What an interesting few years in the real estate world, and the world in general! I got to spend a good bit of time with my niece and nephew over the last 18 months and do a little bit of traveling. After 26 years in the business, I was so grateful and fortunate to have the opportunity to still assist some new and past clients while enjoying that precious time with family!