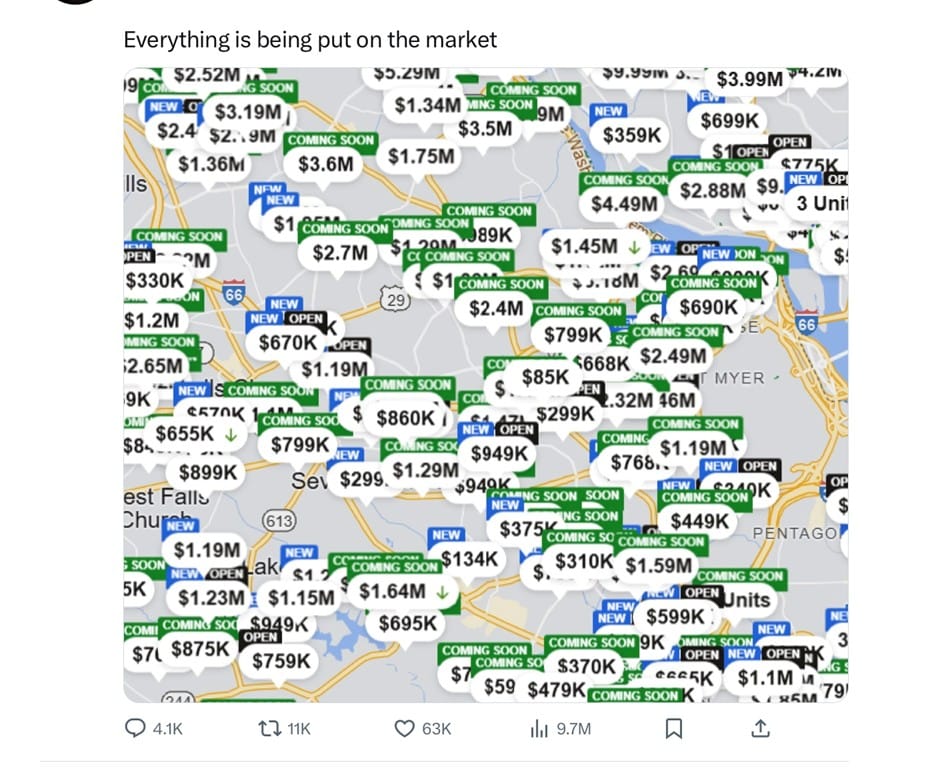
March 2022 Market Update
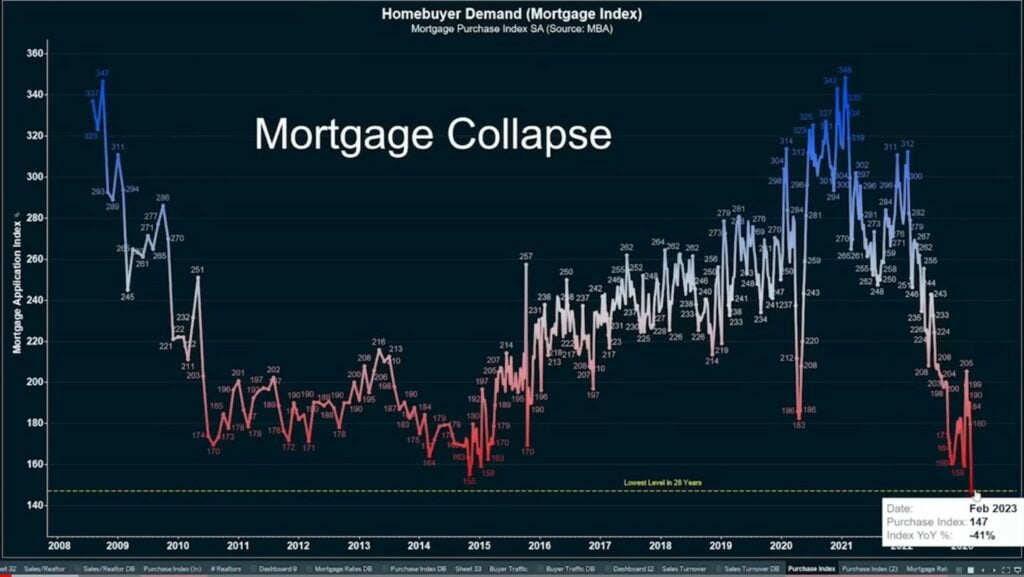
Let’s talk about INVENTORY. Most people don’t realize that inventory level is the key determining factor for real estate prices. If I had a dollar for every time someone asked about the bridge in relationship to values, I would have a whole lot of dollars! And yes, there are a lot of factors that play into value.
For example:
- Condition – buyers today don’t want to fix old problems
- Location – location has always been top of the list
- Rentability – Not every buyer in our market cares about this, but it does help
- Financing – Being able to get good terms
- Insurance – Getting the best premiums makes the home more saleable
However, inventory levels trump all other factors when determining value. Just 3 short years ago the inventory levels in Corolla were over 2 years. Now, it’s barely one month. The old faithful supply and demand is king when it comes to prices going up or down.
Let’s also realize these cycles historically (nearly 100 years worth of data) last for 20 years. The last cycle began in 2000. So regardless of COVID, we were due for an up market. I do believe that COVID accelerated what should have taken 3 years to get where we are into 2 years. That being said, the last up cycle lasted for 5 or 6 years. It’s not clear how long this one will last. Especially with everything going on, who knows.
What we do know is that watching the stats is the same as having a crystal ball. Nothing can change until inventory levels change. That doesn’t look to move any time soon. We are just beginning the spring market where our inventory usually increases by 30%.
Here’s the number of homes currently for sale and under contract for each area.
Area For Sale Under Contract
Corolla – 22 86
4 Wheel – 8 8
Duck – 13 23
Southern Sh 10 16
Kitty Hawk 9 8
KDH 12 53
Nags Head 12 26
These numbers still blow my mind! We all want to know what’s going to happen. Here’s what we can count on, what goes up, must come down. The big question is WHEN? My answer, watch the inventory and you’ll know. When we get back to 4 to 6 months, that’s when it will start.
Meanwhile, if you have any questions about buying or selling in this crazy market, give me a call!
Currituck County’s PRELIMINARY Updated Flood Maps
The following information is copied with permission from the Outer Banks Association of REALTORS(R) .
Currituck County’s PRELIMINARY updated flood maps have been released. Information pdf on how to access the site. The link will take you to the flood map FRIS page, click on ok and then select the County (Currituck).In the upper right corner you will see “effective”. Go there and select “preliminary”. You will be able to look at the new proposed maps that will hopefully be adopted within the next year.
If you zoom in, you will start to see aerial views. By clicking on the map in a particular area you will get the information on the right side of the screen or you can search by using magnifying glass on menu at top left. Most of our county is seeing a significant change to elevations being lowered and many homes will come out of the flood zones or be classified into a lower zone (VE to AE for an example According to the NC Floodplain Mapping Office, the preliminary maps show that Currituck County has 11.5 square miles of V Zone (89.5% decrease from current maps) and 249.5 square miles of A Zone (24.75% increase):
- Under current mapping, there are 1,097 buildings in the V Zone; new maps show 126 buildings in the V Zone;
- Current maps show 7,020 buildings in the A Zone; new maps show 2,767 buildings the A Zone.
There are oceanfront V Zone properties that are coming completely out of the special flood hazard area – being changed to an X Zone!
Please keep in mind that these are only preliminary maps. They will have to undergo a 90-day appeal process, a public meeting process and final FEMA approval. This entire process could take up to 18 months. In the meantime – good news overall for homeowners in the special flood hazard area!
New Price!! Spend your Lazy Summer Days on Your Sun Deck in Corolla!
June Market Update
This month let’s take a look at what’s happening in each specific location for a closer, more in depth view understanding.
Corolla
Corolla Stats | |
Total # of Homes for Sale | 377 |
Total # Selling per month | 17 |
Months of remaining Inventory | 22 |
# of New listings each month | 45 |
Corolla has a 22 month supply of inventory. It’s the weakest market on the Outer Banks right now in terms of supply and demand. Constant price reductions are needed to get homes sold. When a home comes on the market priced well, it will sell quickly.
Duck
Duck Stats | |
Total # of Homes for Sale | 154 |
Total # Selling per month | 8 |
Months of remaining Inventory | 19 |
# of New listings each month | 18 |
One great trend in Duck is that the supply of homes under $300,000 is very diminished. While the inventory issue is still a problem for Duck, homes will sell very fast when priced for the market.
Southern Shores
Southern Shores Stats | |
Total # of Homes for Sale | 93 |
Total # Selling per month | 7 |
Months of remaining Inventory | 13 |
# of New listings each month | 20 |
The Southern Shores market is doing quite well. It has one of the lowest inventory levels of all the towns. Land sales are fantastic in Southern Shores right now.
Kitty Hawk
Kitty Hawk Stats | |
Total # of Homes for Sale | 77 |
Total # Selling per month | 13 |
Months of remaining Inventory | 22 |
# of New listings each month | 19 |
Kitty Hawk between the highways is a fast seller right now. Those homes are a fantastic value and buyers are recognizing that.
Kill Devil Hills
Kill Devil Hills Stats | |
Total # of Homes for Sale | 182 |
Total # Selling per month | 19 |
Months of remaining Inventory | 9.5 |
# of New listings each month | 40 |
By far the most stable market on the Outer Banks right now is Kill Devil Hills. Keep in mind the majority of homes selling here are under $300,000. This area has the best supply and demand situation of all the towns.
Nags Head
Nags Head Stats | |
Total # of Homes for Sale | 190 |
Total # Selling per month | 14 |
Months of remaining Inventory | 13.5 |
# of New listings each month | 25 |
Nags Head is holding it’s own right now. The average price there is $350,000 which makes it super affordable for such a great location.
So as you can see, right now selling a home on the Outer Banks comes solely down to price and condition. Buyers still have too many choices for prices to change any time soon. The good news is we have steady activity in the marketplace right now and it doesn’t seem to be slowing down.