| 2025 | 2026 | |
| Total homes sold | 458 | 443 |
| Median Price | $725,250 | $740,000 |
| Median Days | 37 | 34 |
|
|
|
|
| Corolla | 106 | 117 |
| Duck | 40 | 42 |
| SShores | 48 | 41 |
| Kitty Hawk | 42 | 56 |
| KDH | 129 | 114 |
| Nags Head | 93 | 73 |
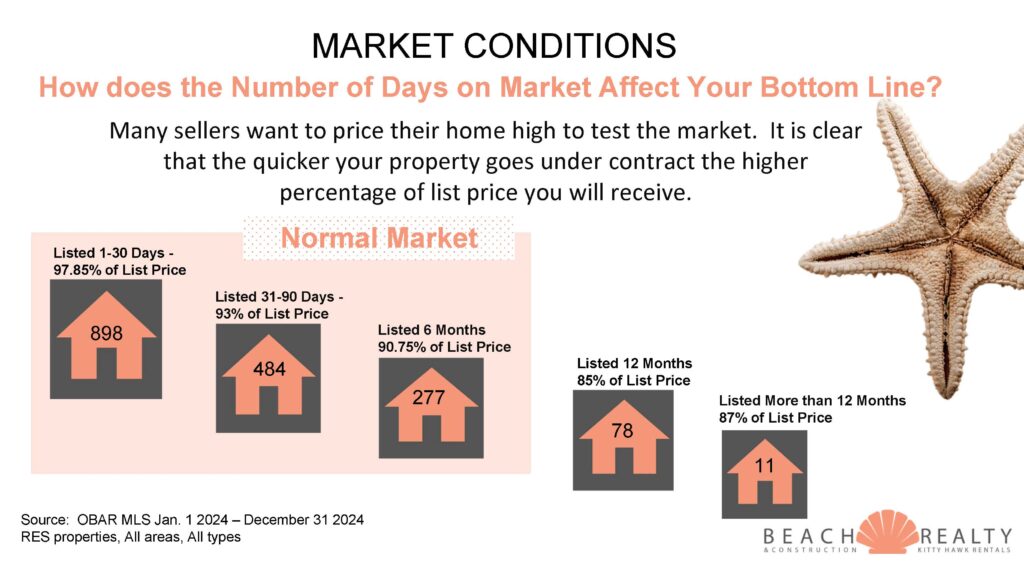
As you can see, not much has changed year over year. Inventory is remaining low, keeping prices steady. Activity seems to be hovering around the same as well. With the days on market at just over a month, it’s pretty easy to tell if your home is priced according to the market.
If you are sitting on equity in your home and want to see what the market value is, contact me for a full analysis.
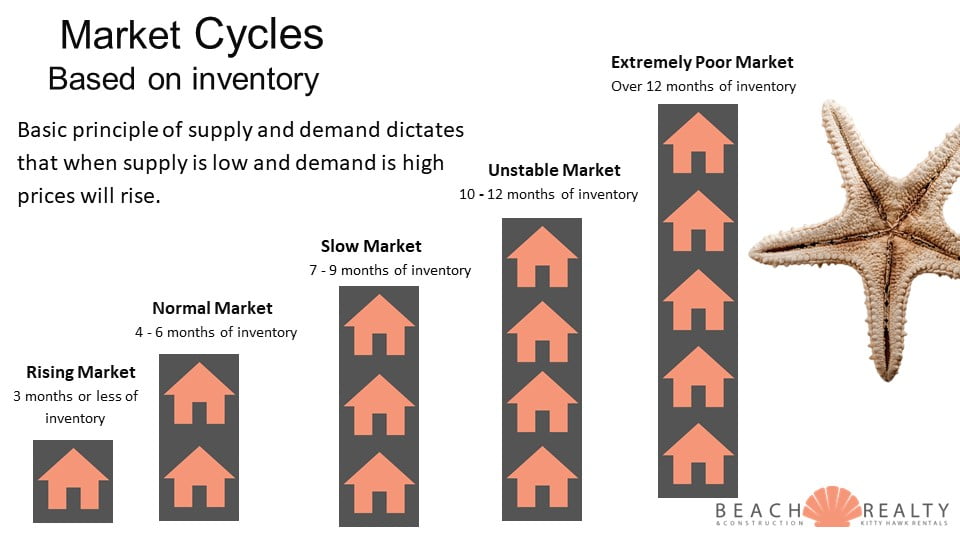
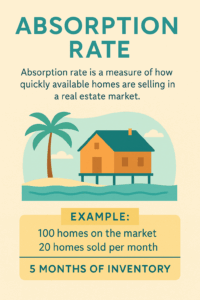 Absorption rate is a key real estate metric that shows how quickly available homes are selling in a specific market.
 Real estate markets across the country are definitely starting to crack. The northeast is really the last holdout and there are signs of a beginning surge in inventory there. With slowing activity and rising inventory, it looks like the OBX could enter a buyers market by the second quarter of next year.

 Now that we have 4 full months of data for 2025, let’s see how it compares to the same time last year. There are some noticeable changes to keep track of which is outlining the little by little deterioration of our current market.