
Nothing tells the story of a market better or more accurately than inventory. This goes back to the basic principle of supply and demand. Inventory levels, or absorption rate, predict the health of a market by comparing what’s on the market, what’s selling, and how long it would take to sell off the current inventory. While most markets show a 5-month supply, indicating a normal market, what’s alarming is that the rate of new listings coming on in most areas is double the number coming off.
Eventually, that leads to a backup of supply. Unless activity picks up to match the new inventory, most of these areas will be in a “slow market” before the end of the 2nd quarter.
Here’s what each area looks like:
| Corolla | Duck | Southern Shores |
| Active – 159 | Active – 25 | Active – 21 |
| Sold/month – 17.6 | Sold/month – 5 | Sold/month – 4.6 |
| Months/Invent – 9 | Months/Invent – 5 | Months/Invent – 5 |
| New/month – 40 | New/month – 15 | New/month – 8 |
| Kitty Hawk | KDH | Colington |
| Active -32 | Active -86 | Active – 35 |
| Sold/month – 6.3 | Sold/month -17 | Sold/month -7 |
| Months/Invent – 5 | Months/Invent – 5 | Months/Invent – 5 |
| New/month – 12 | New/month – 27 | New/month – 14 |
| Nags Head | ||
| Active -74 | ||
| Sold/month – 6.6 | ||
| Months/Invent – 11 | ||
| New/month – 33 |
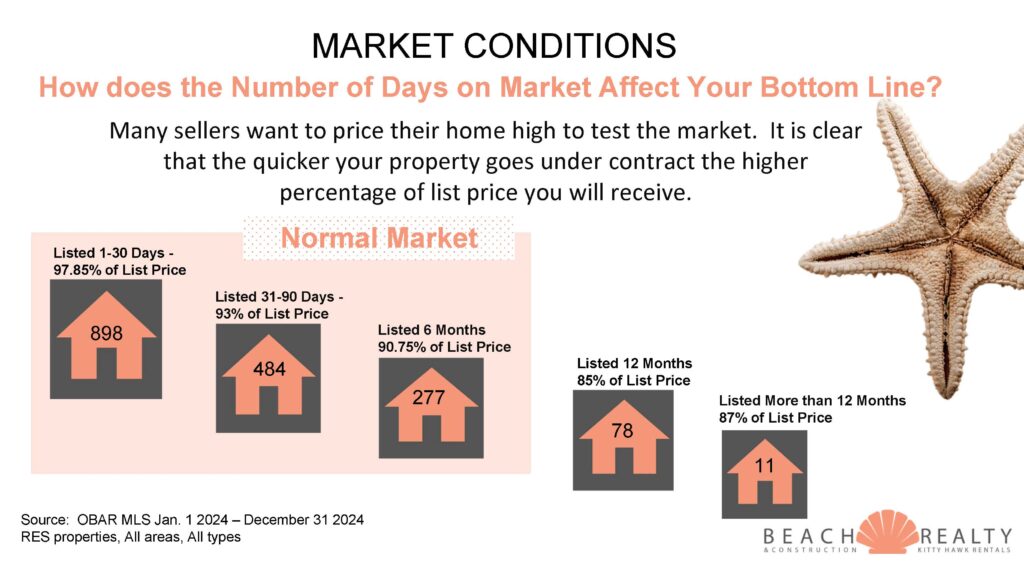
You are watching in real time a market shift from normal – buyer’s market. Inventory is building, and buyer demand is slowing. What’s even more telling is that the homes still selling quickly are the ones with complete updating. If you are thinking of selling, you WILL need to plan ahead and get the right strategy in place in order to have a successful close.
Let me know how I can help.


 What a difference a year makes! Long story short, there are some BIG moves that are happening. I’ve talked before about algorithmic decay. This chart here is exactly that! Little, by little, by little, then bang. That’s how markets change. Tale as old as time, song as old as rhyme, it’s almost as good as a crystal ball.
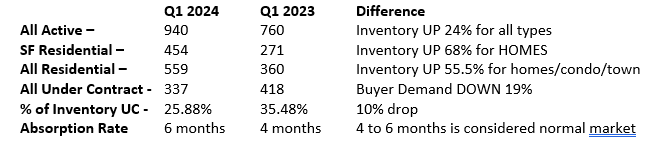
 With all the insurance and septic news, I’m going to be brief on this month’s market report and just give you the numbers straight up. With only one month in, there isn’t a lot to analyze anyway.
 History repeats itself. A saying I’m sure you’ve heard and said dozens of times. I might not yet be a half of a century old, but I’m old enough, and have been in this business long enough (27 years) to recognize a similar pattern. Let’s revisit the timeline of the Outer Banks real estate market from the year 2000.
 What a mild winter we have had here at the beach so far. We are not complaining, that’s for sure.