January Mid-Currituck Bridge Update

With the change of governorship in NC during the November election, it remains to be seen what the state’s position will be on the importance of this bridge project.  Governor McCrory was very committed to the project, as was his team on the DOT.  We have yet to hear what Cooper’s stance is.  With his main guy at the DOT being formerly involved with the EPA, it’s not looking good.

Meanwhile, I came across the letter from the SELC to NCDOT and Federal Highway Authority dated December 21, 2016.  You can read that letter here.  (Warning, it’s very lengthy, but has a great history and timeline of events to how we got where we are.)  In the letter, something caught my attention:

“The new expectation that traffic in the study area will be significantly lighter than previously anticipated and the Transportation Agencies’ failure to incorporate this fact into their analysis.”

Part of their argument against the building of the bridge was this new expectation of traffic.  I kept reading until I came across this info:

“New traffic forecasts, however, have shown that every single one of these predictions is no longer true. Travel demand will no longer exceed road capacity on 29 miles of the road network by 2035, or even 2040.”

I wanted to know why the SELC is reporting a new study shows the traffic patterns would be lower than originally predicted.  In my research I found that it turns out the DOT changed their traffic numbers and projections based on national trends and actual observed traffic counts.

So, basically what happened is DOT put out new numbers, and SELC pounced with another opportunity to squash the project.  While their argument is the same as it has been from the beginning, with the DOT’s own reports now showing a different projection in numbers, will the decision to build the bridge be sustained?  That coupled with new leadership has me feeling a lot of doubt that it will happen.

What are your thoughts?

Read the letter from SELC in December here. http://southernshores-nc.gov/wp-content/uploads/2016/12/December-2016-Comments-on-Mid-Currituck-Bridge-NEPA-Review.pdf


January Outer Banks Market Report

Happy New Year!  I’m really excited about what’s to come in 2017 for the real estate market on the Outer Banks.  There seems to be a burst in consumer confidence, and I hope that positive effect comes to us in full force.  We definitely need it!

We had a huge year for sales in 2012 and things have been pretty stable since then.  It doesn’t surprise me that we saw no increase in the number of sales for 2016 from 2015.  I do suspect we will have a very strong year for 2017 in terms of  number of sales:

Year: 2012 2013 2014 2015 2016
Total # Sold: 2042 2093 2139 2292 2289
Increase from Previous Year 21% 2% 2% 7% 0%


The big question on everyone’s mind is still about price.  We have already seen the interest rates tick up a bit.  That definitely makes it a little more challenging for prices to rise.  The other issue is of course, inventory.  While our inventory levels are down quite a bit, 14% to be exact, we still have an over 12 month supply of properties for sale, in the overall market.

In a few of our specific markets, like Duck and Corolla, the inventory levels are much higher, nearly 24 months’ supply.  The number of buyers would have to triple to bring inventory to an 8 month supply.  Which is still slightly high.  With the latest bridge developments, I’m not sure why the number of buyers would go up that much.  So those areas could still be plagued with an extreme oversupply of inventory, continuing to suppress the pricing.

Meanwhile, the opportunity to buy a home at a great price, with great rental income is high!  Click here for the checklist of what to know before buying on the Outer Banks.

If you’re thinking of selling this year, let’s chat about what I can do for you!

2016 Agent of the Year

Beach Realty & Construction / Kitty Hawk Rentals

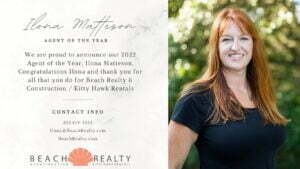
2016 Agent of the Year – Ilona Matteson

OBX Agent of the Year From left to right, Jimbo Ward, President, Ilona Matteson, 2016 Agent of the Year, and Beth Urch, Sales Manager

Ilona Matteson, associate broker for Beach Realty & Construction / Kitty Hawk Rentals, was named the company’s agent of the year for the second year in a row.  Ilona also earned agent of the year honors in 2012.   Ilona was licensed in the late 1990’s and became sales manager for Beach Realty in 2002.  In 2006, she moved to Richmond, VA and was affiliated with a national coaching company where she excelled as a one-on-one coach for real estate professionals.  The allure of the Outer Banks brought her back to the beach and she resumed her career in real estate sales.  She quickly became a top producer and attributes her success to hard work, discipline and in-depth knowledge of the local market.  Along with her successful career in real estate sales, Ilona also offers training and coaching to the sales team at Beach Realty & Construction.

You can contact Ilona at [email protected]

7 Things To Know About Buying Real Estate on the Outer Banks

Here is a list of the top 7 items I discuss with any new buyer who is looking for their vacation or investment home on the Outer Banks.

  1. Be prepared for 20% or more down. Depending on your situation, the bank may require more (like when buying a condo) because it’s not your primary residence.
  2. You can use up to 75% of the rental income the home generates in order to help qualify you for the mortgage. You will need at least a three-year history.  Keep in mind, this will mean you have to apply for an Investor loan which does carry a slightly higher interest rate.
  3. The entire Outer Banks is in a flood zone. Some areas are in flood zone X which means no insurance is required.  Most of our area will qualify for the National Flood Insurance Program, which usually runs less than $800 a year.  (Assuming Congress passes the extension this year)
  4. If you buy a foreclosure, you’ll have to re-furnish the home and buy it as-is. For some reason, the banks just haven’t figured out that the furniture in these vacation homes is valuable and needs to stay.
  5. The local county and city taxes are very low here. We generate so much revenue from the weekly guests in Occupancy Tax and in Transfer Tax on the sale of a home, that the annual taxes can stay very reasonable.
  6. Property Management fees vary based on the services you select from the Manager. It’s sort of an a-la-carte situation these days.  How much you want the Property Manager to do for you will determine the percentage you’ll pay.
  7. The Median Sales Price for a home on the Outer Banks in June 2005 was $507,000. In December 2016, it was $315,000. NOW is a GREAT time to buy your vacation home!

For more information on how to get a home of your own on the Outer Banks, call today!

5 Reasons to List Your Home in the Summer


Although it sounds reasonable to think with all the guests coming, it would be better to just sell the home in the fall or spring, take a look at these 5 reasons you could be missing out by waiting.


  1. Inventory has been our biggest challenge in terms of pricing. June, July and August are historically the time of year when our inventory is the lowest.  Why not take advantage of that incredible opportunity?  Lower inventory means higher prices.
  1. The Outer Banks will have over 3 million visitors each year. Obviously the majority of those folks visit during the summer months.  We cannot get that kind of exposure any other time of year!
  1. The home is fully open and operational. Buyers will have inspections done before closing.  When the house is winterized during the fall/winter, there are extra costs to open the house back up for those inspections.  Right now, everything is up and running and easy to inspect to assure the buyer the home is in good condition.
  1. It’s a beach house! When does the beach look the best?  Summer time of course.  Your beach house will show the best with sun shining, deck chairs out, pool open, hot tub running!  Buyers get excited about these things and it helps to sell your home.
  1. Buyers this time of year are serious about buying! If a potential buyer is going to take time out of their much anticipated vacation to look at your home, it means they are serious about buying.  They’re here with all decision makers too.

If you would like to know what your home is worth in today’s market, or want to see my marketing plan, call or email me today!

2016 Rental Report

I recently attended a meeting where a report was given from the Outer Banks Tourism Board.  There is a reported decline in bookings of about 8% across the board.  What they’re finding is two fold:

  • More Americans are traveling abroad/overseas this year as our dollar exchange is good in Europe and some other locations.
  • More and more visitors are waiting to reserve their homes until the specials come out, hoping to get deeper discounts.

Apparently some rental companies on the coast of South Carolina are experiencing the same occurrence.

If your home is lacking a few weeks, I would like to extend an offer to promote the house for you on my Facebook Business Pages and Twitter account, where I have nearly 2,000 followers collectively.   I can’t guarantee any results, but more exposure certainly can’t hurt.  Send an email to my Marketing Assistant Michelle at [email protected] with your house information and a link to it and we will get you in the rotation.

Southern Shores Flat Top Cottage Tour 2016

The following is reprinted from the Town of Southern Shores:

After a hiatus for 2015, the Southern Shores Historic Flat Top Cottage tour is back, and will be held on Saturday, April 23, 2016 from 1:00 PM to 5:00 PM.  Tour tickets ($5.00) will be available on the day of the tour at 156 Wax Myrtle Trail or 13 Skyline Road.  The $5.00 donation covers visiting all the cottages on the tour. Proceeds will benefit the Flat Top Preservation Fund of the Outer Banks Community Foundation.  This fund was established to provide maintenance funds for the flat top located at 13 Skyline Road, which was donated to the Outer Banks Community Foundation and which serves as its office.

Frank Stick, (1884-1966), beloved Outer Banks artist and developer, obtained an option on the land that is now Southern Shores, and supervised the platting of lots, the installation of roads, and the design and erection of the first flat top cottages.   These now quaint architectural houses were reminiscent of the cottages he had seen in Florida, and were of cement block construction, with wide overhanging soffits, propped up shutters, and flat tar and gravel roofs.

These historic cottages that once dominated the town’s architectural landscape, will be featured in an afternoon of open houses. We are proud to offer more than ten of these gems of varying sizes, locations, styles, and finishes for a self guided open house tour.  Approximately 30 examples of this original architectural style still remain as flat tops in Southern Shores.  The attached photo is of the Mackey cottage, nestled on the oceanfront at 218 Ocean Blvd.

There are two headquarter cottages where tour tickets will be sold: 156 Wax Myrtle Trail (facing Porpoise Run) or 13 Skyline Road (Outer Banks Community Foundation). Maps will be available at headquarter cottages, detailing the addresses of each open house.   Brief histories of the cottages will also be provided.

Red and blue balloons will mark cottages that are open on the day of the event.  Parking will be available at the intersection of Wax Myrtle and Porpoise Run. From here, several cottages participating in the tour will be within walking distance of each other.

In addition to the two headquarter flat tops (Clarke Cottage and Outer Banks Community Foundation), the following cottages are on the tour:  69 Ocean Blvd (Sea Spray), 113 Ocean Blvd (Knight),120 Ocean Blvd (4 Gulls), 157 Ocean Blvd (Sea Breezes), 159 Wax Myrtle Trail (Falconer) 169 Ocean Blvd (Atlantic Breezes), 172 Ocean Blvd (Pink Perfection), 18 E. Dogwood Trail (Oh So Sandy), and 218 Ocean Blvd (Mackey).

Information is also available at the Facebook page for Southern Shores Historic Flat Top Cottages:  https://www.facebook.com/Southern-Shores-Historic-Flat-Top-Cottages-421136131314749/ .

The day before the Flat Top tour, the Kill Devil Hills Historic Landmark Tour will take place on Friday, April 22nd from 1-5 PM. Information is available from the Town of Kill Devil Hills at 252-449-5318.

For additional information about the Southern Shores Flat Top Cottage Tour, please contact Sally and Steve Gudas at 804-399-8342 or [email protected].


2015 Outer Banks Market in Review by Area

2015 was a good year for real estate.  Overall the market finished with an 11% increase in the number of homes sold.  While we still have some work to do, there are very good signs for a lot of the area.

Northern Beaches – Corolla & Duck

Leading the category of still in much need for improvement is Corolla.  Not far behind is the Town of Duck.  The main reason these markets are still showing huge inventory levels and decreasing prices is the lack of a primary market.  In these two locations, 99% of sales are discretionary.  These sellers don’t HAVE to sell and the buyers don’t HAVE to buy.  They are secondary homes.  Without a primary market to stabilize things, the inventory in both areas has remained out of control.

It will be interesting to see how long it will take to get inventory levels to a normal absorption rate of 6 months or less.  It certainly won’t happen quickly.  I think the most notable stat to recognize is the 25% increase in the number of homes sold for Corolla last year.  That’s interesting because in most of 2015 there was a 20 to 21 month supply of homes for sale.  Even AFTER a 25% increase in homes sold, there is STILL TODAY a 19 month supply of homes for sale.  Let that sink in for a minute.

2013 2014 2015
Corolla
Total Sold 171 158 197 25%
Avg Days on Mkt 267 271 250
Avg List Price  $667,649  $728,310  $737,450 1%
Avg Sold Price  $621,037  $683,375  $698,122 2%
Currently Available 291
Average Price $849,894

You’ll notice a slight increase in average sold price above.  Yet, I mentioned that prices are still dropping.  How can that be?  If we look a the breakdown below, you’ll notice there were fewer homes sold under $500,000 and more homes sold over $500,000.  That can skew the average price.  What we do know is the average home in Corolla goes through 3 price reductions before selling, as well as over 200 days on the market.  Both are signs of continued price decline.

2014 2015
Under $350,000 28 18% 35 18%
$350,001 – $500,000 50 32% 57 29%
$500,001 – $700,000 36 23% 51 26%
$700,001 – $1M 22 14% 29 15%
$1M – up 22 14% 25 13%


2013 2014 2015
Duck
Total Sold 82 76 75 -1%
Avg Days on Mkt 254 218 251
Avg List Price  $776,662  $781,055  $661,670 -15%
Avg Sold Price  $714,076  $728,505  $619,861 -15%
Currently Available 150
Average Price  $687,000.00

What’s interesting for Duck is the very clear shift in lower priced homes selling.  The jump in homes sold from $350,000 to $500,000 was massive!  Notice also, the drop in homes sold in the higher priced categories.

2014 2015
Under $350,000 13 17% 12 16%
$350,001 – $500,000 15 20% 25 33%
$500,001 – $700,000 18 24% 13 17%
$700,001 – $1M 20 26% 18 24%
$1M – up 10 13% 7 9%


Southern Shores

Going into 2015, Southern Shores was showing great numbers.  I’m not sure what changed throughout the year, but they didn’t end as strongly as they started.

2013 2014 2015
Southern Shores
Total Sold 70 96 97 1%
Avg Days on Mkt 202 192 235
Avg List Price  $541,660  $519,143  $470,721 -9%
Avg Sold Price  $511,185  $487,978  $444,475 -9%
Currently Available 78
Average Price  $653,286.00

Another Town with a huge increase in homes selling under $350,000 and a drop in sales of those higher priced.  Very interesting to see what will take place in 2016 for Southern Shores as it’s still a very sought after location.

2014 2015
Under $350,000 29 30% 44 45%
$350,001 – $500,000 36 38% 28 29%
$500,001 – $700,000 19 20% 15 15%
$700,001 – $1M 7 7% 8 8%
$1M – up 5 5% 2 2%


Southern Beaches – Kitty Hawk, Kill Devil Hills and Nags Head

You’ll notice quite a few differences with these Town stats than the northern beaches.  Once again we go back to having a primary market.  These areas have been largely helped and stabilized for that reason.

2013 2014 2015
Southern Beaches
Total Sold 411 384 440 15%
Avg Days on Mkt 211 175 170
Avg List Price  $343,527  $368,743  $361,164 -2%
Avg Sold Price  $324,716  $353,107  $345,177 -2%
Currently Available 394
Average Price  $497,639.00

The major news in the southern beaches for price range stats is the increase in homes selling from $350,000 to $500,000.  The rest remained fairly unchanged.

2014 2015
Under $350,000 278 72% 303 69%
$350,001 – $500,000 49 13% 79 18%
$500,001 – $700,000 30 8% 39 9%
$700,001 – $1M 17 4% 10 2%
$1M – up 10 3% 9 2%

It’s my expectation that we will see similar numbers in 2016.  I’m not predicting another year with double digit increases in number of homes sold.  However, it would be lovely to see some serious stabilization in pricing for the northern beaches.  I’m not sure that’s possible with the oversupply of inventory, but it’s on my wish list!

If I can help you with buying or selling on the Outer Banks, let me know!

  • This field is for validation purposes and should be left unchanged.

2015 Agent of the Year

2015 Agent of the Year

From left to right: Beth Urch, Sales Manager, Ilona Matteson, and Jimbo Ward, President.

Ilona Matteson, associate broker for Beach Realty & Construction / Kitty Hawk Rentals was named the company’s agent of the year for 2015.  Ilona also earned agent of the year honors in 2012.

Ilona was licensed in the late 1990’s and became sales manager for Beach Realty in 2002.  In 2006, she moved to Richmond, VA and was affiliated with a national coaching company where she excelled as a one-on-one coach for real estate professionals.  The allure of the Outer Banks brought her back to the beach and she resumed her career in real estate sales.  She quickly became a top producer and attributes her success to hard work, discipline and in-depth knowledge of the local market.  Along with her successful career in real estate sales, Ilona also offers training and coaching to the sales team at Beach Realty & Construction.

You can reach Ilona Matteson in the Duck office of Beach Realty & Construction/ Kitty Hawk Rentals at (252) 261-6600 or email [email protected].


Beach Realty & Construction/Kitty Hawk Rentals is a full-service real estate company offering an attractive and ethical environment for licensed real estate professionals to realize a successful career.  For more information about joining the Beach Realty sales team contact Sales Manager, Beth Urch at (252) 261-3815 or [email protected].  

The 2015 Outer Banks Market Report

We saw a lot of very positive signs in 2015 that continue to lead us on the path to recovery.  While we still have an oversupply of inventory on the market, keeping prices down, we have a double digit increase in number of sales.

The other interesting trend is showing more homes in the higher price ranges are selling and fewer homes offered in the under $300,000 price range.  That is showing our median sales price to be up, even though individual home prices aren’t rising at this point.

It’s virtually impossible for our home values to go up when inventory is still at a 15 month supply.  However, it’s a great step forward.  We saw a 20% increase in number of sales for 2012, then it steadied for 2 years until another big increase in sales for 2015.

Mortgage brokers are expecting a surge in activity the first part of 2016 to beat the Fed’s promise of rising interest rates.  We certainly have a year round market on the OBX and see great activity all year long.  The two spikes in activity happen in March/April and September/October.  No need to wait though, we can get your home sold any time of year.

Here is the breakdown of where we ended up for 2015:

  • Residential number of sales were up 11%
  • Average sales price was down 2%
  • Land sales numbers were down 5%
  • Average sales price was up 7%
  • Inventory was down 8%, being the lowest since 2007
  • Foreclosed home sales were down 37%

Next month I’ll provide a break down of each location individually so you can see how it compares year over year.

If you have any questions or would like additional information please let me know.

  • This field is for validation purposes and should be left unchanged.