 What a mild winter we have had here at the beach so far. We are not complaining, that’s for sure.
I’ve got a couple of pretty interesting topics this month…let’s dive in.
Market Report
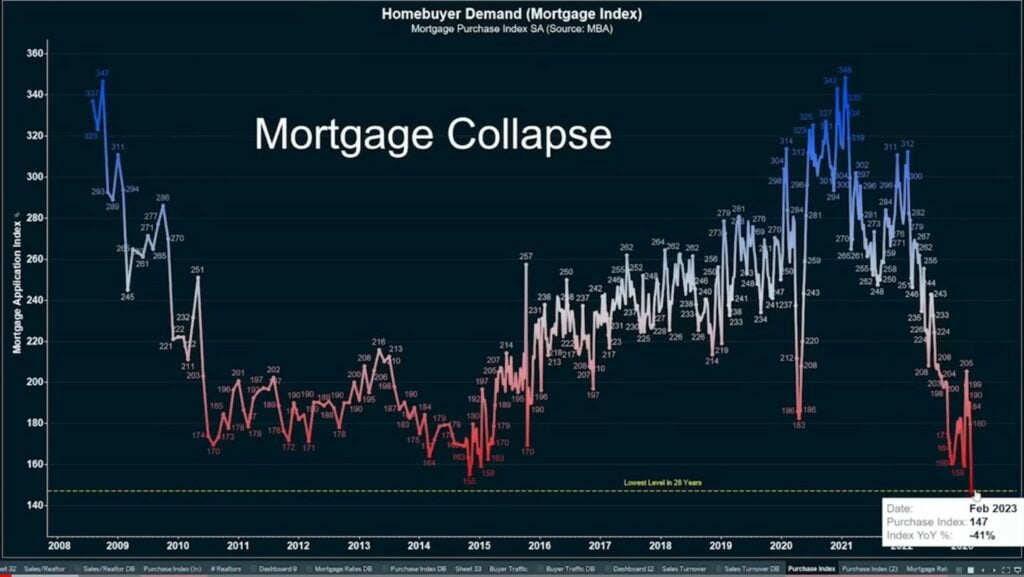
Anyone who knows me knows I’m generally an optimist by nature. I have to say some of the economic factors going on are raising my level of concern for our local market this year. While the OBX is a primarily second home market, we are late to see the effects of the primary market shifts. Believe me, changes are on the way, click here for more.
Mid Currituck Bridge
Ah yes…the long-awaited bridge. If you’ve been waiting around for this thing since the 90’s like me, you will probably see this as a nice reminder this project is not completely dead, and also hard to get hopeful again. Read more here.
Taste of the Beach
Yes, it’s March and time for my absolute favorite OBX Event of the year! If you’ve never been, you are missing out on some of the best dining experiences we have to offer. If you can make it to town the weekend of March 24 – 26th, you won’t be sorry! Let me know what some of your favorites are! Click here for the event website.
Agent of the Year
I was honored and excited to receive this award again for 2022. I’m grateful to my wonderful client base and friends for the amazing support I’ve had in my career. This is year 27 for me in the business. I have been very blessed. Read more here.

 What an interesting few years in the real estate world, and the world in general! I got to spend a good bit of time with my niece and nephew over the last 18 months and do a little bit of traveling. After 26 years in the business, I was so grateful and fortunate to have the opportunity to still assist some new and past clients while enjoying that precious time with family!
 Let’s talk about INVENTORY. Most people don’t realize that inventory level is the key determining factor for real estate prices. If I had a dollar for every time someone asked about the bridge in relationship to values, I would have a whole lot of dollars! And yes, there are a lot of factors that play into value.