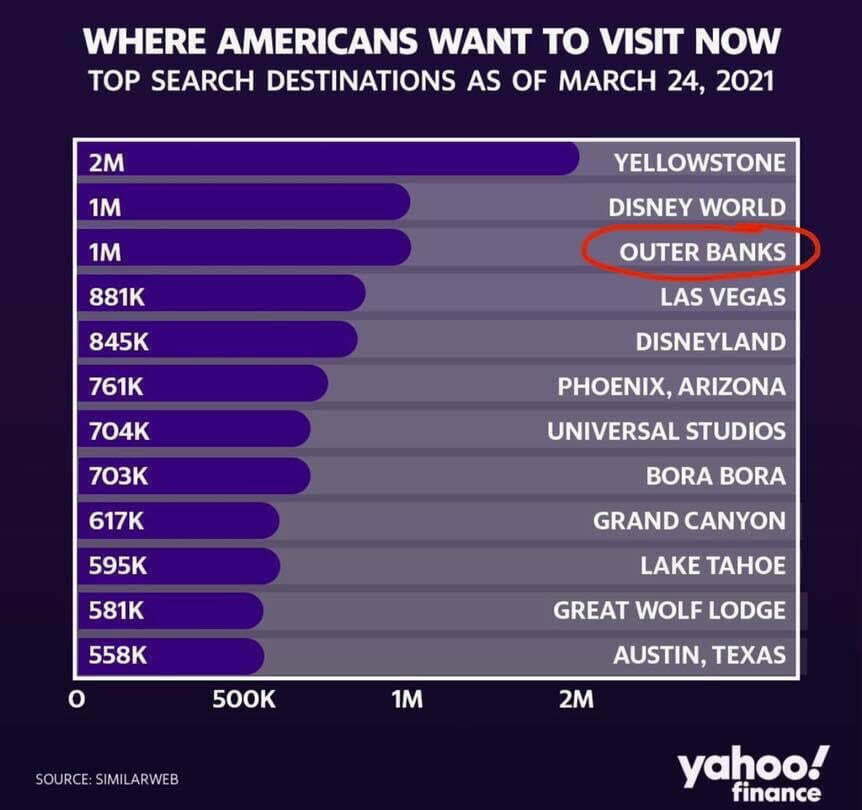
As of right now, the Outer Banks is experiencing what is considered to be a “normal market”. That means we are not seeing prices change in any significant way up or down. While prices are still at what is considered to be somewhat inflated, there’s not been real measurable changes so far. Secondly, we still have a balanced level of inventory. A normal market is considered to be a demand level of 4 to 6 months of inventory. We are sitting right in the middle at 5 months of inventory. This means the demand is steady and supply is still rather low. In comparison at the peak times in 2021 and 2022, we had just a 2-month inventory.
This begs the question, where are we headed? There are 3 factors I’m watching to help determine that. What’s great about Beach Realty is we watch the statistics every single week. It’s just as good as having a crystal ball. The numbers change in a gradual way that you can actually see the shifts coming if you’re paying attention, which we are!
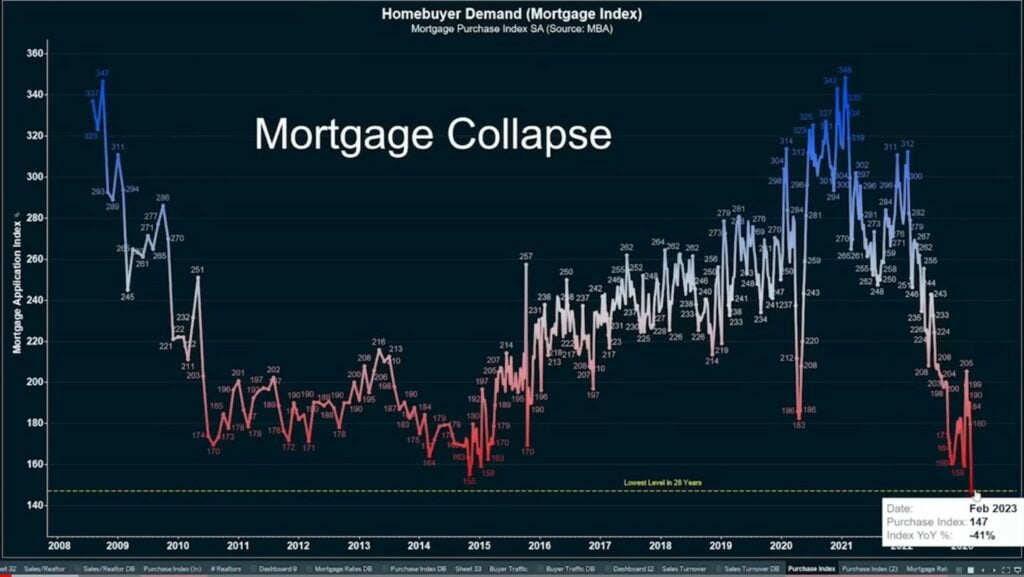
Factor 1 – Mortgage Applications
Year over year nationwide mortgage applications to buy a home has fallen 41%. In just a YEAR! It’s currently at the lowest level in 28 years right now. That’s even worse than the mortgage crash that happened in 2008. Coupled with data from NAR, only 29% of recent home purchases are cash. The most obvious cause is rising interest rates and still inflated home prices. As a second home market, over 70% of our home sales are a discretionary purchase. It’s a decision buyers can wait on, especially if they think changes are coming soon.
Factor 2 – FNMA and Second Homes
About a year ago Fannie Mae basically got out of the second home business. Wanting to pull support from second homes and focus more on first time home buyer programs they negotiated a deal with the Mortgage Bankers Association to drastically increase rates on second homes. Which at the time didn’t seem too objectionable on conforming loans because the conforming loan limit was $548,250. With the average second home here being near $700,000, most buyers wouldn’t be affected. Now the limit is $726,200 for a conforming loan, coupled with the most attractive rates being a now 75% LTV, the rates shot up over 7% with one point. Making it even more expensive than ever to buy a home on the Outer Banks with a conforming limit mortgage. I don’t know the exact percentage of second home mortgages that are sold to Fannie Mae, but I think an educated guess would be MOST of them. The only solution is for mortgage brokers to keep the loans on their books and try to offer more attractive rates. Who knows how long that will last and how many lenders will participate. I only know of one broker with that program right now.
Factor 3 – Rising Inventory
As buyer demand continues to soften due to rates and prices, inventory will start to creep up this spring and summer. That could lead us directly into an inventory level over 6 or 7 months by fall. That pushes us back into a buyer’s market. If rental receipts drop this year, as expected, this fall we could see prices take a very noticeable hit. How much is yet to be determined. However, with as high as prices rose over the last few years, even a 10% drop would likely still put the home higher than pricing was in 2019. So all is not lost, for this year at least.
If you’re thinking about selling, NOW is your window. Give me a call to discuss further.
 What an interesting few years in the real estate world, and the world in general! I got to spend a good bit of time with my niece and nephew over the last 18 months and do a little bit of traveling. After 26 years in the business, I was so grateful and fortunate to have the opportunity to still assist some new and past clients while enjoying that precious time with family!
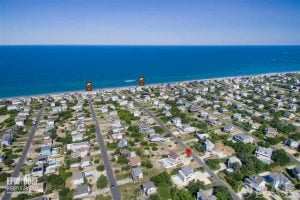 Let’s talk about INVENTORY. Most people don’t realize that inventory level is the key determining factor for real estate prices. If I had a dollar for every time someone asked about the bridge in relationship to values, I would have a whole lot of dollars! And yes, there are a lot of factors that play into value.
 Although it sounds reasonable to think with all the guests coming, it would be better to just sell the home in the fall or spring, take a look at these 5 reasons you could be missing out by waiting.