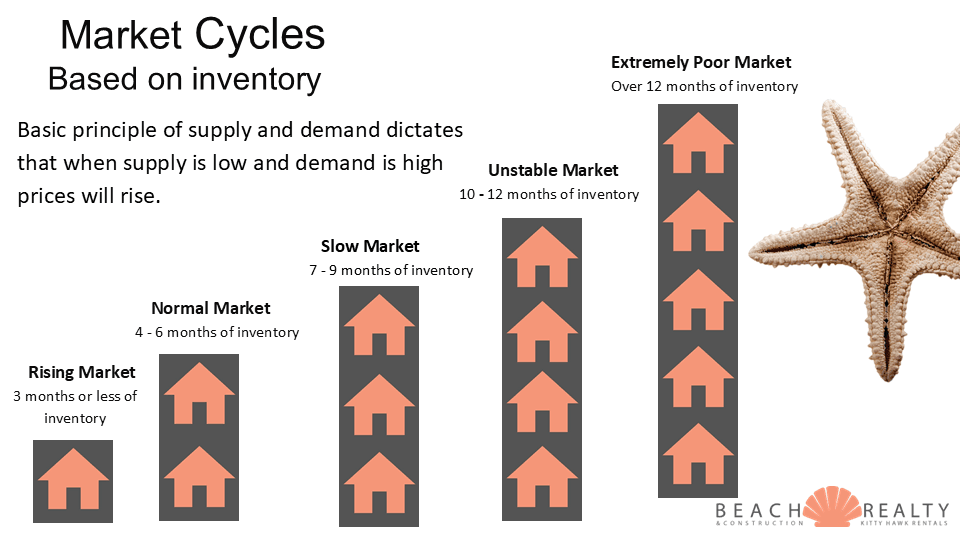
We have officially put both feet into a slow market, which is defined as 7 to 9 months of inventory.

Here are the stats you need to know:
| Market Metric |
OBX Statistics |
| Total # of Properties for Sale |
917 |
| Total # of Selling per Month |
109 |
| Months of remaining Inventory |
8.4 |
| # of New Listings each Month |
213 |
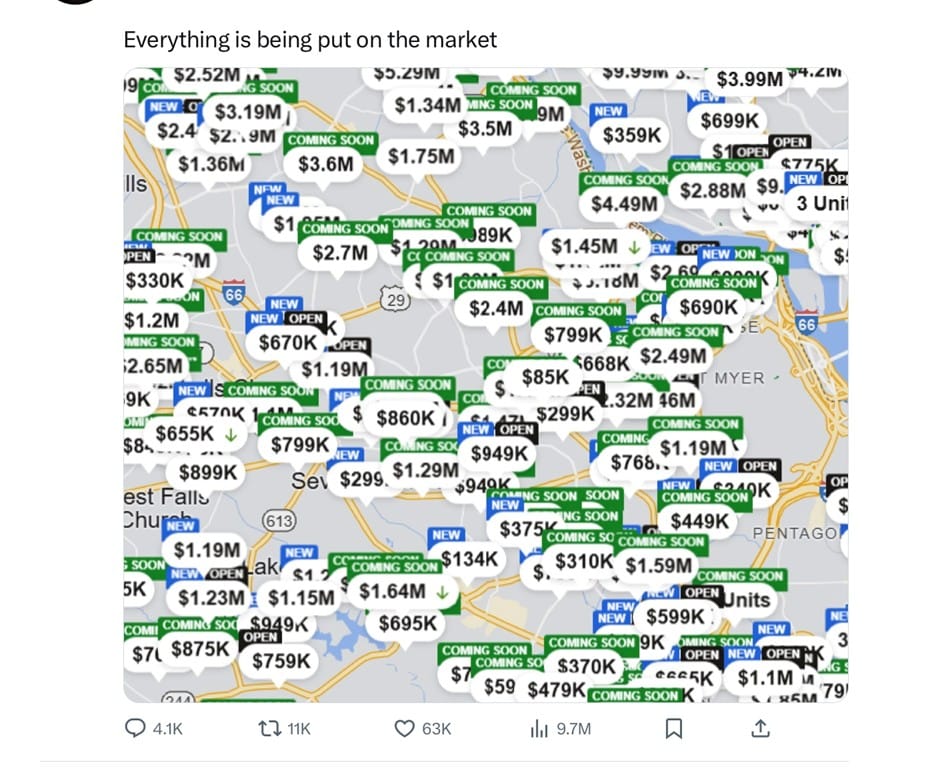
If you are thinking about selling, remember back to the 2008 cycle. This is the point where sellers thought prices would bounce back, so they wait. Buyers felt prices may soften so they waited. Who wins the waiting game in a declining market?
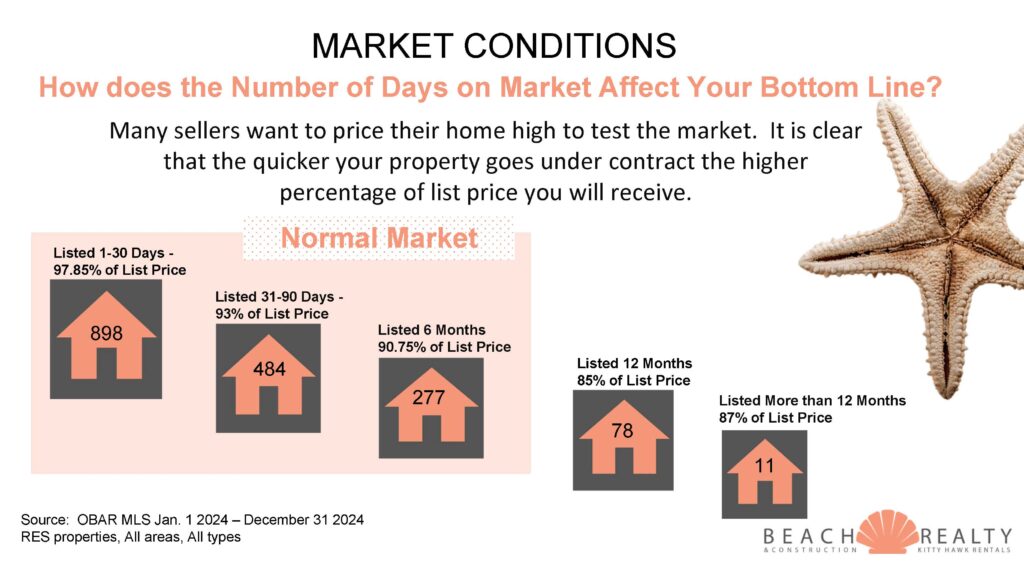
If you want to net the most, selling earlier in the cycle rather than later is how you will net more. Contact me for a full analysis for your home.
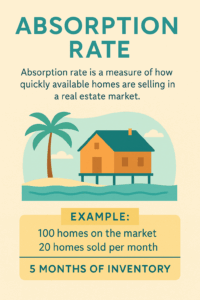 Absorption rate is a key real estate metric that shows how quickly available homes are selling in a specific market.

 Now that we have 4 full months of data for 2025, let’s see how it compares to the same time last year. There are some noticeable changes to keep track of which is outlining the little by little deterioration of our current market.