May OBX Update

Ilona Matteson May Market UpdateNow that we have 4 full months of data for 2025, let’s see how it compares to the same time last year. There are some noticeable changes to keep track of which is outlining the little by little deterioration of our current market.
Keep in mind, markets don’t drop overnight. If you pay attention, you can most certainly see it coming. The main reason these shifts take 5 to 6 years is due to the state of denial many sellers find themselves in at the beginning of the shift. Markets are fluid. You have to adjust as new information comes in if you want to net the most when selling in an actively changing market, such as what we have right now.

Here’s how each area breaks down:

Jan to Apr 2024  

Jan to Apr
2025

New Listings

1,294

1,351

*Inventory UP 5%
Price Reductions

770

933

*Price changes UP 29%
Sold Listings 

685

658

*Buyer demand DOWN 5%


This data tells us year-over-year inventory is creeping up, demand is slowing, but PRICING is
changing at a rapid pace. Homes are still selling within 30 days if priced right.

Buyers are making offers knowing the price correction is coming, and they are trying to build it in on the front end. Be prepared to start your listing strategy with a value forward stance on price. Do not try to build in a negotiation buffer, it will only cost you time on the market and an eventual price correction down the road.

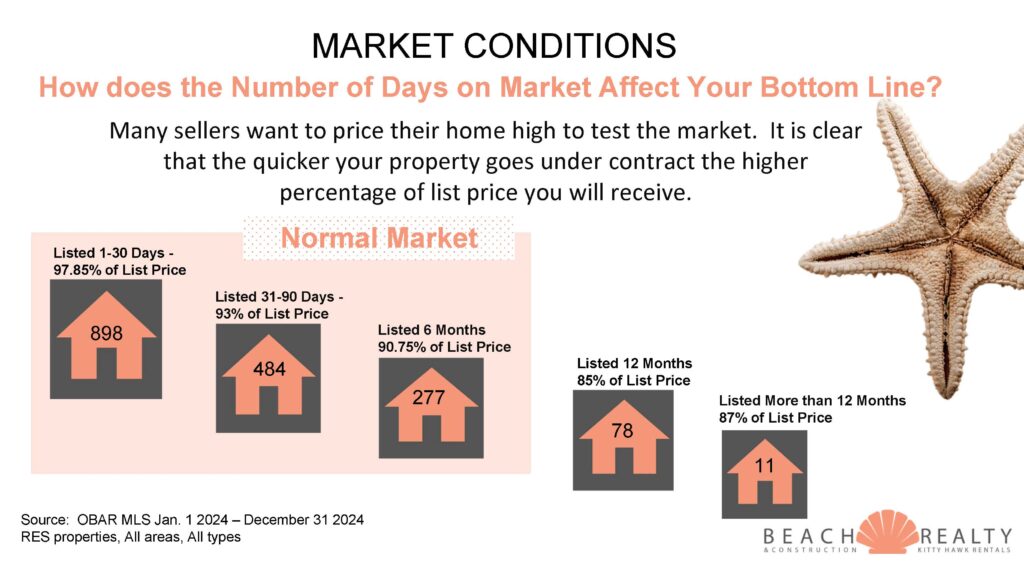
Our statistics show us if you price it correctly and sell within 30 days, typically it will sell for 97.85% of asking price.

If you are thinking about buying or selling, contact me so we can create a winning strategy for your goals.

March OBX Market Report 2025

The impact of slowly rising inventory and decreased demand is starting to add up here on the Outer Banks.  Don’t get me wrong, homes in good condition, location and priced right are still selling very quickly.  We don’t have an overabundance of inventory, yet.  However, we are definitely seeing some markets shifting faster than others.

Here’s how each area breaks down:

Area Active Listings Sold/
Month
Month
 Supply
Corolla 161 10.6 15
Duck 33 3 11
S. Shores 32 5 6.4
Kitty Hawk 24 7 3.4
Kill Devil Hills 121 23 5.2
Nags Head 48 10 4.8


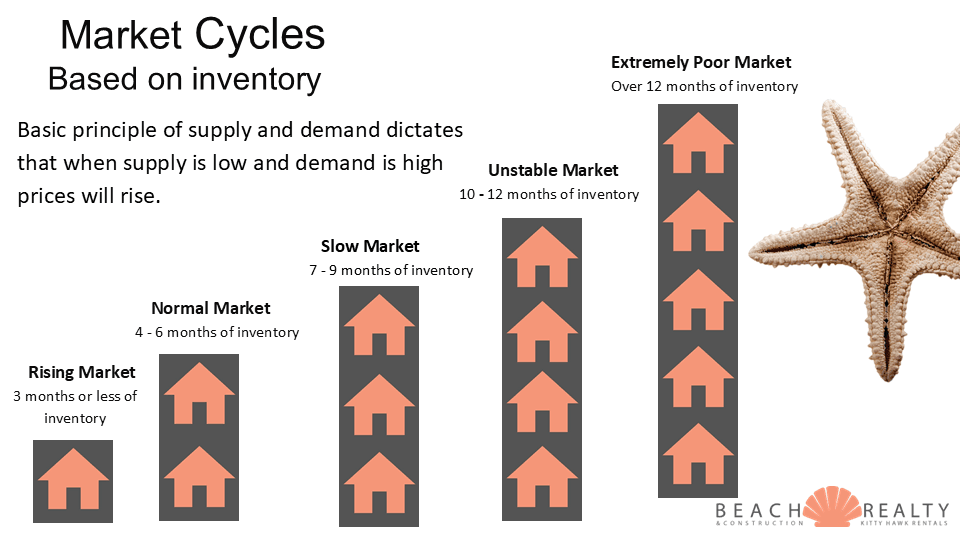
The relationship of inventory to number of homes sold per month gives us the absorption rate.  The absorption rate tells us how many months it would take to sell out the inventory at the current rate of sales.  That is a direct reflection of the “health” of a market, or describes what type of market we are in.  The chart below lists this out.  Based on this, you can see how each area is performing.

OBX Market Chart 2025

When shifting to a different market it’s common to see some areas performing differently than others.  If you consider the higher end markets will generally slow down first, and that is reflected here.

If you are thinking of selling in one of those markets, the time is now.

Februrary Market Update

2025 February market update

With the latest news of the DC and Metro housing market, it is yet to be seen if or how that may trickle down to the OBX.  A healthy percentage of our secondary homeowners live in that area.  It would only take a 20% increase in our inventory, if buyer demand stays the same, to push us into a 9 month absorption rate.  That would then put us on the verge of an unstable market.  We need to keep a close eye on how this will affect us.

Everything on the Market

As for our latest stats, here’s what is happening:

Mid February 2025 Mid February 2024
Active All 1,153 889
Active Houses 586 411
Under Contract 287 331
3 Mo Sold Avg 155 147
Absorp Rate 7.4 5.9

The numbers speak for themselves.  Inventory is up, activity is down.  We are seeing 75% of properties selling under list price.  This is indicative of a normal market.  We have only a small window of excess inventory before we enter “unstable” territory.

If you’re on the fence about selling, you might want to take a closer look.


2024 Agent of the Year

Agent of the Year 2024

Beach Realty is proud to announce the Agent of the Year for 2024, Ilona Matteson!
Ilona has been the recipient of this award numerous times and continues to be a leader on our Team!
Join us in celebrating all of Ilona’s hard work!
Buying or Selling call Ilona 252.619.5225

January 2025 Update

Market Banner

2024 market saw a few distinct changes.  Higher inventory and massive price reductions.  We are already starting to see a small change in pricing – roughly 5 – 7% depending on location.  If inventory keeps rising, we could see the pricing change go up.

Here’s how December Year over Year looks:

December 2024

December 2025

Active – 585 Active – 434 *Single Family
U/C – 244 U/C – 235 *All Classes
Absorption Rate – 6.59 Absorption Rate – 4.89


As you can see inventory is up 35%.

Yet the number of properties under contract is about the same.  While that number has not gone down, what happens when you have more homes for sale and the same or fewer buyers?  Law of supply and demand is in play.  That is why the absorption rate (months of inventory) has gone up so much.

The statistics are telling us the slow down will continue this year.  With mortgage rates higher and mortgage applications at their lowest levels ever, we could see a double-digit drop in pricing this year.  I’ll be watching!

November OBX Update

Ilona Matteson - Outer Banks

November Market Update

Still a bit of a holding pattern in what supply and demand would still deem a “Normal Market”.

Normal is an inventory level of 4 to 6 months. We are right on the cusp of moving to a “Slow Market” where the advantage shifts over to the buyers in the market.

January 2024 November 2024
Active Inventory All 870 1187
Active Inventory Homes 424 595
Under Contract 24% 19.50%
Absorption Rate 5.4 6.7
SF Absorption Rate 4.3 5.3
Price Reductions/Month 171 271

If you would like a more specific analysis for your real estate goals, give me a call!

July OBX Market Stats

While there isn’t much change to report this month, I predict by October/November there will be more inventory and the beginning of a quantifiable shift in pricing. You know I’ll keep you posted! To see the full effect of the logarithmic path, I’m comparing January 2024 to July 2024.

Jan 2024 Jul 2024
Months of Inventory 4.8 5.9
Active Homes 492 700
% Under Contract 24% 21%
Price Changes/Month 171 232


image of OBX Market Cycles

2024 Second Half of the Year Weird Market Selling Strategy

As we approach the second half of the year, it’s important to notice the little shifts happening along the way.  Remember, real estate markets don’t crash overnight.  It happens slowly at first, then all of a sudden.  We are in the slowly at first phase.

Our market here gets insulated because it’s not a primary market.  Being a discretionary sale and discretionary purchase for the majority of transactions, it provides a lag time from when we start to see primary markets destabilize.

If you are thinking about what to do with your OBX investment home, you need to look big picture.  Consider first and foremost, just because you don’t HAVE to sell, does not automatically mean that keeping the home is in the best financial interest for your family.  Always consult your financial adviser for guidance.

Let’s now take a look at the two options, sell or keep.  Regardless of what you choose, this information will help you set up the best expectations for either choice.

Sell

  • Good news! Prices are still at record highs.  You have not missed the boat.
  • However, pricing strategy must remain fluid. No longer set the price and then 3 months later look at it.  If you want to maximize profit here, you must be the trend setter, not the follower.
  • Inventory is rising – up 29% from this time last year
  • Demand is dropping – down almost 10% from last year, and last year demand dropped 50% from 2022
  • Price reductions are increasing – in May 368 new listings came on and 287 listings had a price reduction
  • Must be negotiable – 66% of properties sold are below asking price.
  • Affordability is still the number one concern for buyers

If you employ a listing strategy with this in mind, you will maximize your return and get the home sold in a reasonable amount of time.

Keep

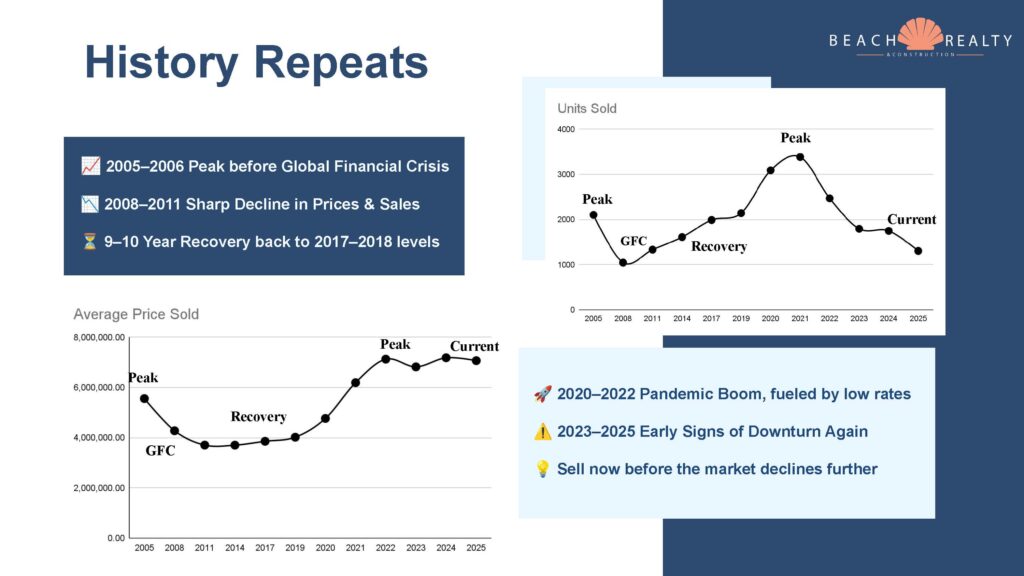
  • Remember how these cycles have worked over the years.
    • Boom 1985/86 – fell apart early 90’s – stagnant until 2000.
    • Boom again 2004/05 – fell apart 2008/09 stagnant until 2019/20.
    • Boom 2021/22 – 2023 activity dropped by half, pricing is just starting to crack with price reductions and under asking price sales.
    • If the pattern continues it could be stagnant again until 2035 or longer.
  • Rising Insurance as well as other increasing vendor costs.
    • be prepared for at least a 14% increase in dwelling policies and unknown yet for homeowners.
    • Service providers are increasing costs: lawn care, pool/hot tub maintenance, linens, etc
  • Return to pre-pandemic rental income.
    • It starts with lower vacancy rates. 2024 is already seeing only 90% booking.
    • Next will be set lower rates – discounts are already happening.
    • If you stay, the cost to own will go up, with income to support going down.
  • Prepare for capital improvements.
    • Tightening insurance underwriting regulations are requiring updates to stay insured. Roof, water heater, etc
    • Continued lack of demand for homes that have not been updated. Especially as inventory increases, you’ll need to have prime condition and updating to be chosen.
    • Reality of a major storm this year or next. Let’s face it, no one likes to say it, but we haven’t had a hurricane since 2018.  Generally, we see a 6 to 9 year pattern.

If you do decide to keep the home through the next cycle, let’s at least put together a plan to get your home updated and where to best spend the money.  I also have a list of trusted vendors who can help you get things done.

Now that you have the big picture, let me know if I can be of any help as we navigate this next market shift.

May OBX Market Update

May OBX Market UpdateIn a nutshell, the market here is changing…slowly…but surely.  These types of cycle shifts don’t happen all at once.  Fortunately, because I study the market every day, I can help you see it coming.  After all, you can get out of the way of what you don’t see!

Here are the basics we are watching:

Inventory

Total Everything – up 27% since January (currently over 1,000 listings)

           Homes, Single Family and Condos/Townhomes – up 24%

Activity

Absorption Rate has gone from 4.8 months to 5.5 months since January

This means it would take longer to sell the homes we currently have on the market.  Once this goes over 6 months, we enter a Slow Market

Price

53.5% of homes are still selling within 0-30 days, of those…

97% of asking price is what they are selling for

67% of homes are now selling under asking price

Basic supply and demand economics tell us that when supply is inching up, demand is inching down that prices will start to waiver.  How long will this current market last?  We just have to keep watching. We are noticing more price reductions coming in and fewer multiple offers.  This is an active situation.  Stay tuned for next month’s report!

If you have thought about buying or selling, let me know so we can plan your strategy.

First Quarter 2024 Comparison to First Quarter 2023

OBX Real Estate Market - Crystal Ball and upward graphWhat a difference a year makes!  Long story short, there are some BIG moves that are happening.  I’ve talked before about algorithmic decay.  This chart here is exactly that!  Little, by little, by little, then bang.  That’s how markets change.  Tale as old as time, song as old as rhyme, it’s almost as good as a crystal ball.

Anyone saying the real estate market on the Outer Banks is not changing is just not paying attention.

But, look here, and you decide:

Image of the differences between 2023 and 2024 in the OBX Real Estate Market

We are on the cusp of a price shift potentially starting this fall.  Here are the facts about our market:

  • Insurance costs are rising and coverage dropping
  • Interest rates are not changing any time soon
  • Rental income is back to pre-pandemic levels

If you are on the fence about selling your home, your window is closing before we start to see quantifiable price shifts.  Call me today to discuss the best strategy for selling in today’s changing market.