
Nothing tells the story of a market better or more accurately than inventory. This goes back to the basic principle of supply and demand. Inventory levels, or absorption rate, predict the health of a market by comparing what’s on the market, what’s selling, and how long it would take to sell off the current inventory. While most markets show a 5-month supply, indicating a normal market, what’s alarming is that the rate of new listings coming on in most areas is double the number coming off.
Eventually, that leads to a backup of supply. Unless activity picks up to match the new inventory, most of these areas will be in a “slow market” before the end of the 2nd quarter.
Here’s what each area looks like:
| Corolla | Duck | Southern Shores |
| Active – 159 | Active – 25 | Active – 21 |
| Sold/month – 17.6 | Sold/month – 5 | Sold/month – 4.6 |
| Months/Invent – 9 | Months/Invent – 5 | Months/Invent – 5 |
| New/month – 40 | New/month – 15 | New/month – 8 |
| Kitty Hawk | KDH | Colington |
| Active -32 | Active -86 | Active – 35 |
| Sold/month – 6.3 | Sold/month -17 | Sold/month -7 |
| Months/Invent – 5 | Months/Invent – 5 | Months/Invent – 5 |
| New/month – 12 | New/month – 27 | New/month – 14 |
| Nags Head | ||
| Active -74 | ||
| Sold/month – 6.6 | ||
| Months/Invent – 11 | ||
| New/month – 33 |
You are watching in real time a market shift from normal – buyer’s market. Inventory is building, and buyer demand is slowing. What’s even more telling is that the homes still selling quickly are the ones with complete updating. If you are thinking of selling, you WILL need to plan ahead and get the right strategy in place in order to have a successful close.
Let me know how I can help.

 Absorption rate is a key real estate metric that shows how quickly available homes are selling in a specific market.
 Now that we have 4 full months of data for 2025, let’s see how it compares to the same time last year. There are some noticeable changes to keep track of which is outlining the little by little deterioration of our current market.
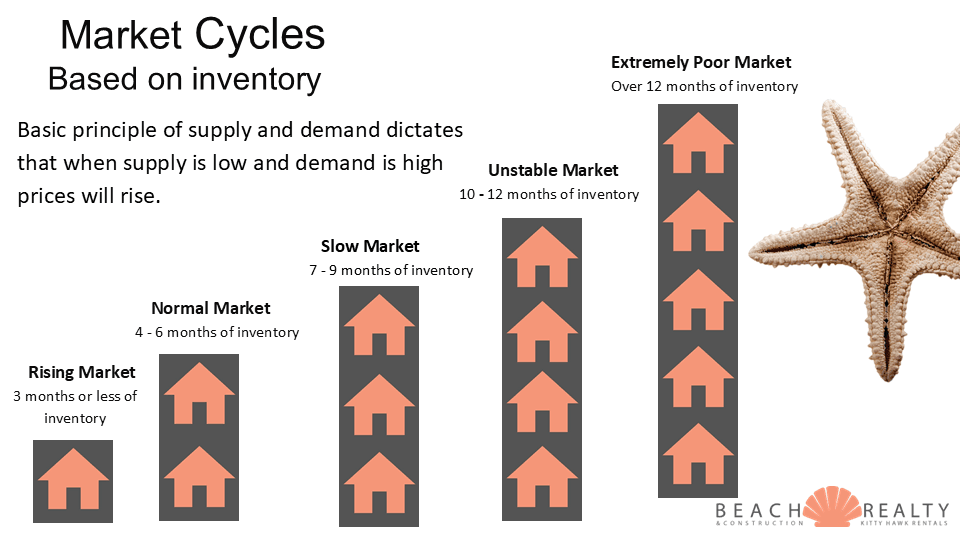


 As we approach the second half of the year, it’s important to notice the little shifts happening along the way. Remember, real estate markets don’t crash overnight. It happens slowly at first, then all of a sudden. We are in the slowly at first phase.