The impact of slowly rising inventory and decreased demand is starting to add up here on the Outer Banks. Don’t get me wrong, homes in good condition, location and priced right are still selling very quickly. We don’t have an overabundance of inventory, yet. However, we are definitely seeing some markets shifting faster than others.
Here’s how each area breaks down:
| Area | Active Listings | Sold/ Month |
Month Supply |
| Corolla | 161 | 10.6 | 15 |
| Duck | 33 | 3 | 11 |
| S. Shores | 32 | 5 | 6.4 |
| Kitty Hawk | 24 | 7 | 3.4 |
| Kill Devil Hills | 121 | 23 | 5.2 |
| Nags Head | 48 | 10 | 4.8 |
The relationship of inventory to number of homes sold per month gives us the absorption rate. The absorption rate tells us how many months it would take to sell out the inventory at the current rate of sales. That is a direct reflection of the “health” of a market, or describes what type of market we are in. The chart below lists this out. Based on this, you can see how each area is performing.
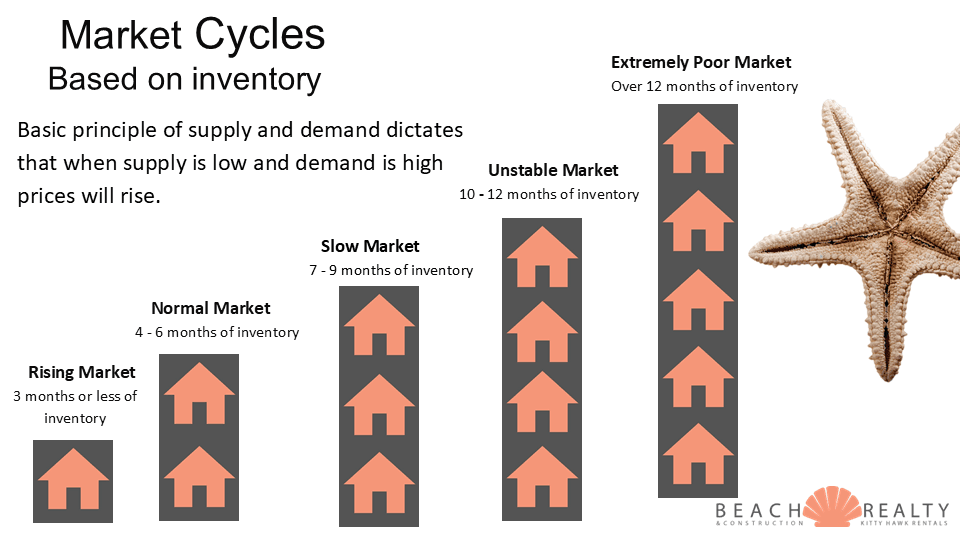
When shifting to a different market it’s common to see some areas performing differently than others. If you consider the higher end markets will generally slow down first, and that is reflected here.
If you are thinking of selling in one of those markets, the time is now.


 With all the insurance and septic news, I’m going to be brief on this month’s market report and just give you the numbers straight up. With only one month in, there isn’t a lot to analyze anyway.
 History repeats itself. A saying I’m sure you’ve heard and said dozens of times. I might not yet be a half of a century old, but I’m old enough, and have been in this business long enough (27 years) to recognize a similar pattern. Let’s revisit the timeline of the Outer Banks real estate market from the year 2000.
 Mid-year is upon us and not much has changed since the last report. I did notice an interesting trend regarding CASH in our marketplace. Here’s the deal. There have been 136 home sales in Duck and Corolla since January.