Every Cycle Tells the Same Story
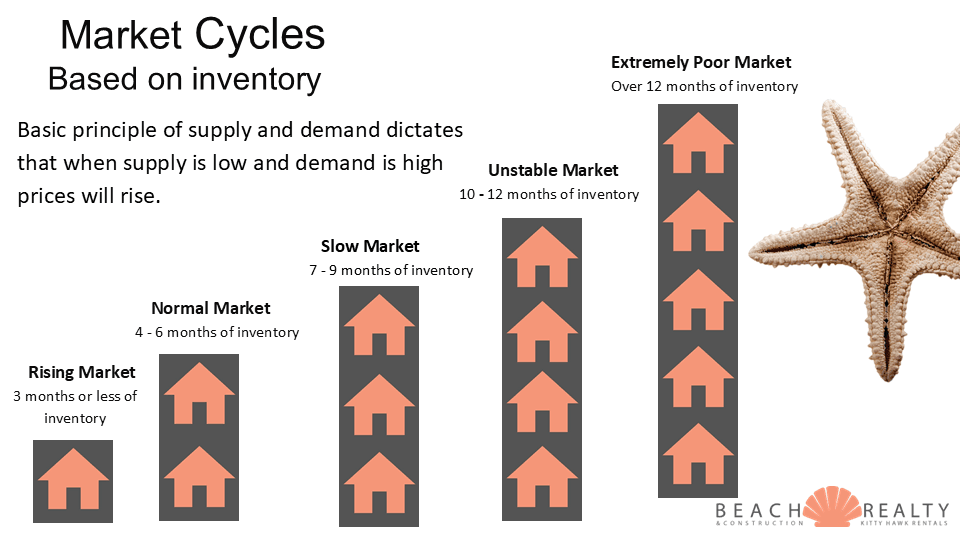
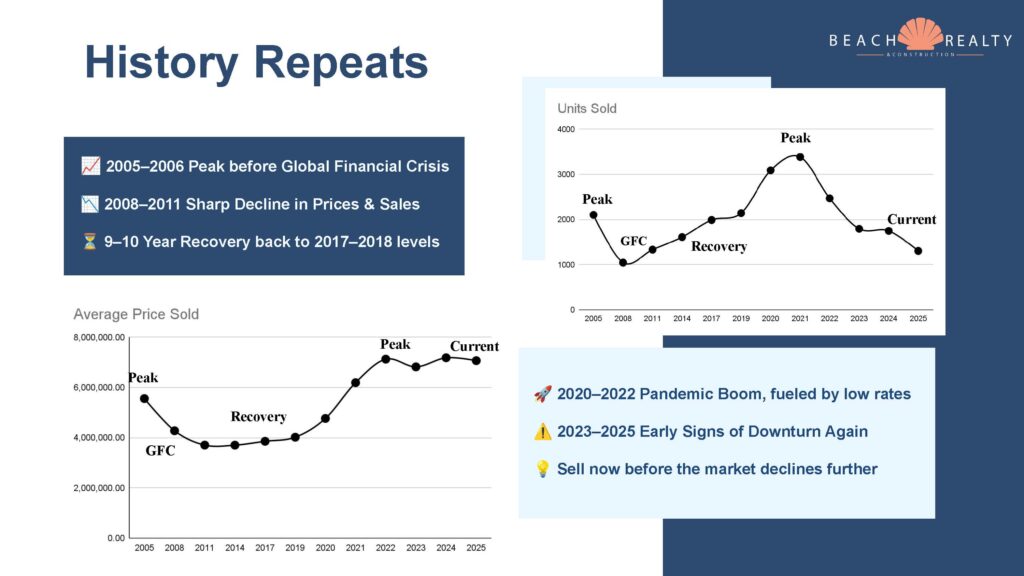
In 2005 and 2006, we hit a major peak before the 2008 financial crisis struck. From 2008 through 2011, prices and sales activity fell sharply — and it took nearly a full decade to recover. Then came another boom from 2020 to 2022, fueled by record-low interest rates and intense buyer demand. Now, as we move through 2023–2025, we’re beginning to see familiar signs: softening demand, rising inventory, and leveling prices.
That pattern should sound familiar — because it’s the start of the next cycle.
The Psychology of the Market
We all remember that subprime mortgages triggered the 2008 crash. What’s happening now is broader — economists call it the “everything bubble.” Once bubbles begin to deflate, it typically takes four to five years to reach the bottom. The reason? Seller denial. Sellers hold out, convinced prices will bounce back, while buyers wait for better deals. In a resort market like ours, where neither side must move, both dig in.
Sellers say, “I’ll just keep it for now.” Buyers say, “I’ll wait until prices drop.”
And who wins the waiting game? Buyers do — every time.
Key Takeaways
• The last downturn took nearly a decade to recover.
• We’re seeing early signs of another correction.
• Selling before the decline accelerates protects your equity.
• Waiting could mean competing with more sellers at lower prices — and watching your gains fade over
years, not months.

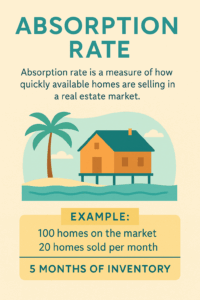 Absorption rate is a key real estate metric that shows how quickly available homes are selling in a specific market.
 Real estate markets across the country are definitely starting to crack. The northeast is really the last holdout and there are signs of a beginning surge in inventory there. With slowing activity and rising inventory, it looks like the OBX could enter a buyers market by the second quarter of next year.

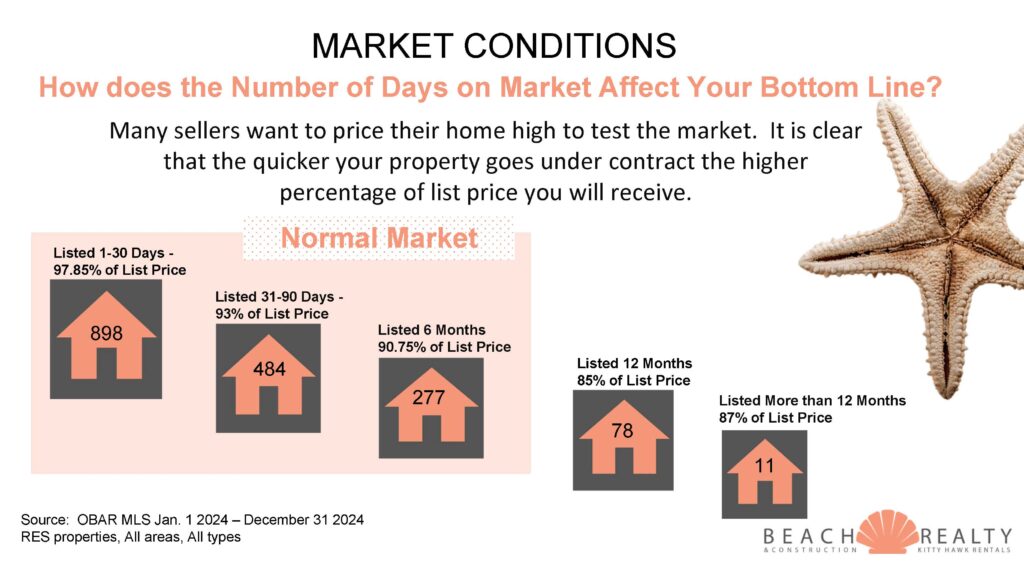
 Now that we have 4 full months of data for 2025, let’s see how it compares to the same time last year. There are some noticeable changes to keep track of which is outlining the little by little deterioration of our current market.