With the latest news of the DC and Metro housing market, it is yet to be seen if or how that may trickle down to the OBX. A healthy percentage of our secondary homeowners live in that area. It would only take a 20% increase in our inventory, if buyer demand stays the same, to push us into a 9 month absorption rate. That would then put us on the verge of an unstable market. We need to keep a close eye on how this will affect us.
As for our latest stats, here’s what is happening:
| Mid February 2025 | Mid February 2024 | |
| Active All | 1,153 | 889 |
| Active Houses | 586 | 411 |
| Under Contract | 287 | 331 |
| 3 Mo Sold Avg | 155 | 147 |
| Absorp Rate | 7.4 | 5.9 |
The numbers speak for themselves. Inventory is up, activity is down. We are seeing 75% of properties selling under list price. This is indicative of a normal market. We have only a small window of excess inventory before we enter “unstable” territory.
If you’re on the fence about selling, you might want to take a closer look.

 In a nutshell, the market here is changing…slowly…but surely. These types of cycle shifts don’t happen all at once. Fortunately, because I study the market every day, I can help you see it coming. After all, you can get out of the way of what you don’t see!
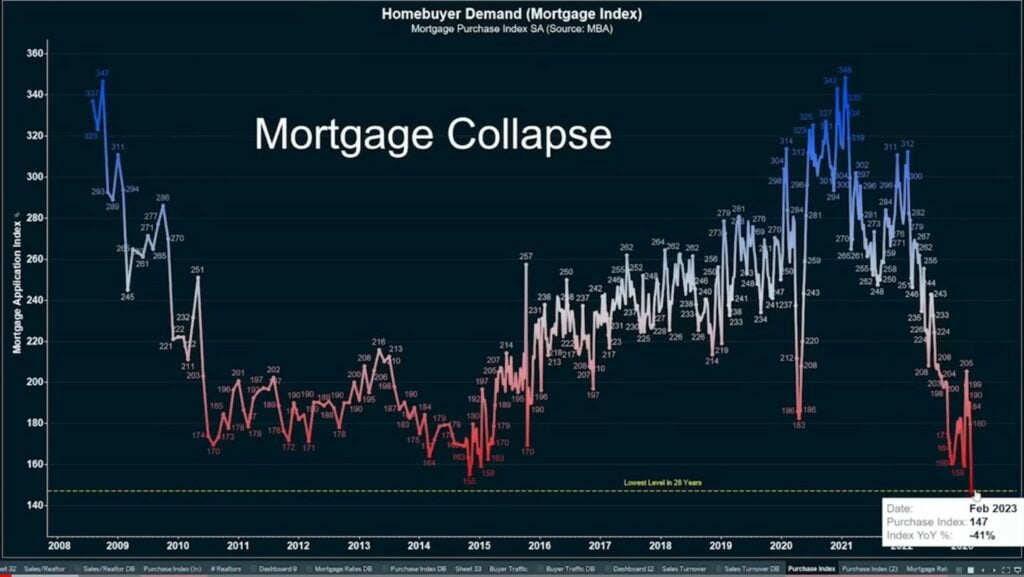
 What a difference a year makes! Long story short, there are some BIG moves that are happening. I’ve talked before about algorithmic decay. This chart here is exactly that! Little, by little, by little, then bang. That’s how markets change. Tale as old as time, song as old as rhyme, it’s almost as good as a crystal ball.
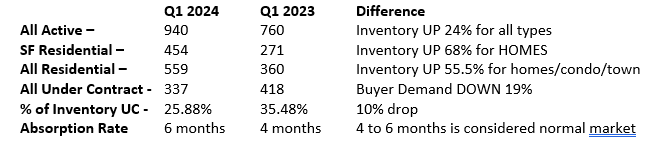
 A lot of agents will do presentations on how they came up with a price for your home. It is a task that does require some skill. The challenge of course is getting the seller to agree to the pricing suggestions.