We have officially put both feet into a slow market, which is defined as 7 to 9 months of inventory.

Here are the stats you need to know:
| Market Metric |
OBX Statistics |
| Total # of Properties for Sale |
917 |
| Total # of Selling per Month |
109 |
| Months of remaining Inventory |
8.4 |
| # of New Listings each Month |
213 |
If you are thinking about selling, remember back to the 2008 cycle. This is the point where sellers thought prices would bounce back, so they wait. Buyers felt prices may soften so they waited. Who wins the waiting game in a declining market?
If you want to net the most, selling earlier in the cycle rather than later is how you will net more. Contact me for a full analysis for your home.


 What a difference a year makes! Long story short, there are some BIG moves that are happening. I’ve talked before about algorithmic decay. This chart here is exactly that! Little, by little, by little, then bang. That’s how markets change. Tale as old as time, song as old as rhyme, it’s almost as good as a crystal ball.
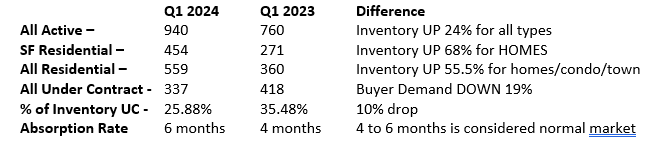
 With all the insurance and septic news, I’m going to be brief on this month’s market report and just give you the numbers straight up. With only one month in, there isn’t a lot to analyze anyway.
 History repeats itself. A saying I’m sure you’ve heard and said dozens of times. I might not yet be a half of a century old, but I’m old enough, and have been in this business long enough (27 years) to recognize a similar pattern. Let’s revisit the timeline of the Outer Banks real estate market from the year 2000.
 What a mild winter we have had here at the beach so far. We are not complaining, that’s for sure.