2016 Rental Report

I recently attended a meeting where a report was given from the Outer Banks Tourism Board.  There is a reported decline in bookings of about 8% across the board.  What they’re finding is two fold:

  • More Americans are traveling abroad/overseas this year as our dollar exchange is good in Europe and some other locations.
  • More and more visitors are waiting to reserve their homes until the specials come out, hoping to get deeper discounts.

Apparently some rental companies on the coast of South Carolina are experiencing the same occurrence.

If your home is lacking a few weeks, I would like to extend an offer to promote the house for you on my Facebook Business Pages and Twitter account, where I have nearly 2,000 followers collectively.   I can’t guarantee any results, but more exposure certainly can’t hurt.  Send an email to my Marketing Assistant Michelle at [email protected] with your house information and a link to it and we will get you in the rotation.

Average Sales Price Versus Reality

So I was reading the latest statistics prepared by our Association, which is an amazing service they provide, and I started to get a little excited!  The report is that Average and Median Sales Price are up!  I looked deeper into each Town and area, and noticed a few really bright spots in our market…according to the Median sales price.

One challenge with the data is the comparison is for the entire year of 2015, to just the first 4 months of the year.  Not exactly apples to apples.  However, a few locales are showing significant increases in Median Sales Price.

Does that mean prices are finally starting to go up?   Sadly, not really.  What it does mean is that consumer confidence is strong, so there are more homes selling in the upper price ranges than the previous time period.  That is still a very good sign.  If that continues, and inventory levels have a chance to straighten out, we could then see prices rising again.

The bottom line truth is the basic principle of supply and demand will always dictate our pricing structure.  There is no way around it, I’m afraid.  So if you see reports of our market prices rising…just remember it means more homes in the higher price ranges are selling, not necessarily that prices are going up.  When our area still has 17 months of inventory, it’s hard to imagine that environment producing rising prices.

One other item I considered was, are there fewer homes for sale in the lower price ranges, causing people to buy in the higher price range?  Take a look at a few of the examples below.

For example:

Duck reporting a 13% increase in Median Sales Price

2015               2016

13                       8                      Homes sold under $500,000

7                       11                      $501,000 – $900,000

4                        3                      Over $901,000

Currently 167 homes for sale, 7 sales a month = 24 month supply of homes for sale

Currently 71 homes for sale $500,000 and under

Corolla reporting only a 2% increase in Median Sales Price

2015               2016

33                   30                      Homes sold under $500,000

22                   15                       $501,000 – $900,000

10                   14                       Over $901,000

Currently 370 homes for sale, 17 sales a month = 22 month supply of homes for sale

Currently 147 homes for sale $500,000 and under

*Also important to note the difference in pricing of the over $901,000 – in 2016, there were 6 sales over $1,200,000 versus 2015, only 2.

In 2015 the lowest home sale was $218,000 and 6 under $300,000.  In 2016 the lowest sale was $102,000 and there were 8 under $300,000.  Hard to make a case for a 2% increase in price with that data.

Kill Devil Hills reporting a 14% increase in Median Sales Price

2015               2016

49                   38                       Homes sold under $300,000

8                     15                       $301,000 – $500,000

6                      3                        Over $501,000

Currently 180 homes for sale, 18 sales a month = 10 month supply of homes for sale

Currently 80 homes for sale $300,000 and under

So…As you can see from the numbers above, the higher end sales are seeing a nice surge.  I promise, as soon as prices start to rise, you’ll be the first to know!  Meanwhile, I’m still very excited that consumer confidence is increasing, and Jumbo loans are clearly not an issue.  Rates are still under 4%, which is amazing.  The bottom line is, as always, if you want to sell your home, we can do it!  If you’re thinking of investing, the time is right!


March Outer Banks Market Report

True to history, we are already seeing a spike in sales for this month.  In just the first 17 days we already have 20% more homes under contract than last March.  That’s very exciting news.  On the other hand, what we also have is over a year of inventory.

The basic principle of supply and demand just simply will not allow prices to rise.  Inventory is too high for the number of buyers in the market.  Prices will continue to be affected.

I’ve been saying for 5 years, that if you want to wait for prices to go up to sell your home, you’ll be waiting at least 3 to 5 years.  Well, after 5 years, prices still haven’t gone up.  So now, I’m saying 7 to 10 more years.  Sadly, it’s just going to take that long based on the statistics.

Real estate is a long-term investment. If you’re in the market to buy now and plan to own the home for 10 to 20 years, don’t worry.  You’ll be fine.

If you’re still on the fence about selling, just consider the cost to own your home for the next 10 years, versus pricing it to sell now.  Then ask yourself a very serious question…Is it more important to get your price, or to get the home sold?  Exactly how much longer do you want to own this home?  If you’re waiting on price, it could be a while.

If I can help you answer any questions about buying or selling, please let me know.

Southern Shores Flat Top Cottage Tour 2016

The following is reprinted from the Town of Southern Shores:

After a hiatus for 2015, the Southern Shores Historic Flat Top Cottage tour is back, and will be held on Saturday, April 23, 2016 from 1:00 PM to 5:00 PM.  Tour tickets ($5.00) will be available on the day of the tour at 156 Wax Myrtle Trail or 13 Skyline Road.  The $5.00 donation covers visiting all the cottages on the tour. Proceeds will benefit the Flat Top Preservation Fund of the Outer Banks Community Foundation.  This fund was established to provide maintenance funds for the flat top located at 13 Skyline Road, which was donated to the Outer Banks Community Foundation and which serves as its office.

Frank Stick, (1884-1966), beloved Outer Banks artist and developer, obtained an option on the land that is now Southern Shores, and supervised the platting of lots, the installation of roads, and the design and erection of the first flat top cottages.   These now quaint architectural houses were reminiscent of the cottages he had seen in Florida, and were of cement block construction, with wide overhanging soffits, propped up shutters, and flat tar and gravel roofs.

These historic cottages that once dominated the town’s architectural landscape, will be featured in an afternoon of open houses. We are proud to offer more than ten of these gems of varying sizes, locations, styles, and finishes for a self guided open house tour.  Approximately 30 examples of this original architectural style still remain as flat tops in Southern Shores.  The attached photo is of the Mackey cottage, nestled on the oceanfront at 218 Ocean Blvd.

There are two headquarter cottages where tour tickets will be sold: 156 Wax Myrtle Trail (facing Porpoise Run) or 13 Skyline Road (Outer Banks Community Foundation). Maps will be available at headquarter cottages, detailing the addresses of each open house.   Brief histories of the cottages will also be provided.

Red and blue balloons will mark cottages that are open on the day of the event.  Parking will be available at the intersection of Wax Myrtle and Porpoise Run. From here, several cottages participating in the tour will be within walking distance of each other.

In addition to the two headquarter flat tops (Clarke Cottage and Outer Banks Community Foundation), the following cottages are on the tour:  69 Ocean Blvd (Sea Spray), 113 Ocean Blvd (Knight),120 Ocean Blvd (4 Gulls), 157 Ocean Blvd (Sea Breezes), 159 Wax Myrtle Trail (Falconer) 169 Ocean Blvd (Atlantic Breezes), 172 Ocean Blvd (Pink Perfection), 18 E. Dogwood Trail (Oh So Sandy), and 218 Ocean Blvd (Mackey).

Information is also available at the Facebook page for Southern Shores Historic Flat Top Cottages:  https://www.facebook.com/Southern-Shores-Historic-Flat-Top-Cottages-421136131314749/ .

The day before the Flat Top tour, the Kill Devil Hills Historic Landmark Tour will take place on Friday, April 22nd from 1-5 PM. Information is available from the Town of Kill Devil Hills at 252-449-5318.

For additional information about the Southern Shores Flat Top Cottage Tour, please contact Sally and Steve Gudas at 804-399-8342 or [email protected].


2015 Outer Banks Market in Review by Area

2015 was a good year for real estate.  Overall the market finished with an 11% increase in the number of homes sold.  While we still have some work to do, there are very good signs for a lot of the area.

Northern Beaches – Corolla & Duck

Leading the category of still in much need for improvement is Corolla.  Not far behind is the Town of Duck.  The main reason these markets are still showing huge inventory levels and decreasing prices is the lack of a primary market.  In these two locations, 99% of sales are discretionary.  These sellers don’t HAVE to sell and the buyers don’t HAVE to buy.  They are secondary homes.  Without a primary market to stabilize things, the inventory in both areas has remained out of control.

It will be interesting to see how long it will take to get inventory levels to a normal absorption rate of 6 months or less.  It certainly won’t happen quickly.  I think the most notable stat to recognize is the 25% increase in the number of homes sold for Corolla last year.  That’s interesting because in most of 2015 there was a 20 to 21 month supply of homes for sale.  Even AFTER a 25% increase in homes sold, there is STILL TODAY a 19 month supply of homes for sale.  Let that sink in for a minute.

2013 2014 2015
Corolla
Total Sold 171 158 197 25%
Avg Days on Mkt 267 271 250
Avg List Price  $667,649  $728,310  $737,450 1%
Avg Sold Price  $621,037  $683,375  $698,122 2%
Currently Available 291
Average Price $849,894

You’ll notice a slight increase in average sold price above.  Yet, I mentioned that prices are still dropping.  How can that be?  If we look a the breakdown below, you’ll notice there were fewer homes sold under $500,000 and more homes sold over $500,000.  That can skew the average price.  What we do know is the average home in Corolla goes through 3 price reductions before selling, as well as over 200 days on the market.  Both are signs of continued price decline.

2014 2015
Under $350,000 28 18% 35 18%
$350,001 – $500,000 50 32% 57 29%
$500,001 – $700,000 36 23% 51 26%
$700,001 – $1M 22 14% 29 15%
$1M – up 22 14% 25 13%


2013 2014 2015
Duck
Total Sold 82 76 75 -1%
Avg Days on Mkt 254 218 251
Avg List Price  $776,662  $781,055  $661,670 -15%
Avg Sold Price  $714,076  $728,505  $619,861 -15%
Currently Available 150
Average Price  $687,000.00

What’s interesting for Duck is the very clear shift in lower priced homes selling.  The jump in homes sold from $350,000 to $500,000 was massive!  Notice also, the drop in homes sold in the higher priced categories.

2014 2015
Under $350,000 13 17% 12 16%
$350,001 – $500,000 15 20% 25 33%
$500,001 – $700,000 18 24% 13 17%
$700,001 – $1M 20 26% 18 24%
$1M – up 10 13% 7 9%


Southern Shores

Going into 2015, Southern Shores was showing great numbers.  I’m not sure what changed throughout the year, but they didn’t end as strongly as they started.

2013 2014 2015
Southern Shores
Total Sold 70 96 97 1%
Avg Days on Mkt 202 192 235
Avg List Price  $541,660  $519,143  $470,721 -9%
Avg Sold Price  $511,185  $487,978  $444,475 -9%
Currently Available 78
Average Price  $653,286.00

Another Town with a huge increase in homes selling under $350,000 and a drop in sales of those higher priced.  Very interesting to see what will take place in 2016 for Southern Shores as it’s still a very sought after location.

2014 2015
Under $350,000 29 30% 44 45%
$350,001 – $500,000 36 38% 28 29%
$500,001 – $700,000 19 20% 15 15%
$700,001 – $1M 7 7% 8 8%
$1M – up 5 5% 2 2%


Southern Beaches – Kitty Hawk, Kill Devil Hills and Nags Head

You’ll notice quite a few differences with these Town stats than the northern beaches.  Once again we go back to having a primary market.  These areas have been largely helped and stabilized for that reason.

2013 2014 2015
Southern Beaches
Total Sold 411 384 440 15%
Avg Days on Mkt 211 175 170
Avg List Price  $343,527  $368,743  $361,164 -2%
Avg Sold Price  $324,716  $353,107  $345,177 -2%
Currently Available 394
Average Price  $497,639.00

The major news in the southern beaches for price range stats is the increase in homes selling from $350,000 to $500,000.  The rest remained fairly unchanged.

2014 2015
Under $350,000 278 72% 303 69%
$350,001 – $500,000 49 13% 79 18%
$500,001 – $700,000 30 8% 39 9%
$700,001 – $1M 17 4% 10 2%
$1M – up 10 3% 9 2%

It’s my expectation that we will see similar numbers in 2016.  I’m not predicting another year with double digit increases in number of homes sold.  However, it would be lovely to see some serious stabilization in pricing for the northern beaches.  I’m not sure that’s possible with the oversupply of inventory, but it’s on my wish list!

If I can help you with buying or selling on the Outer Banks, let me know!

  • This field is for validation purposes and should be left unchanged.

2015 Agent of the Year

2015 Agent of the Year

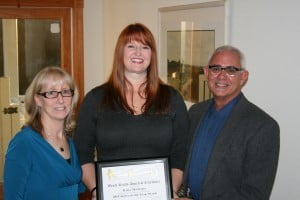
From left to right: Beth Urch, Sales Manager, Ilona Matteson, and Jimbo Ward, President.

Ilona Matteson, associate broker for Beach Realty & Construction / Kitty Hawk Rentals was named the company’s agent of the year for 2015.  Ilona also earned agent of the year honors in 2012.

Ilona was licensed in the late 1990’s and became sales manager for Beach Realty in 2002.  In 2006, she moved to Richmond, VA and was affiliated with a national coaching company where she excelled as a one-on-one coach for real estate professionals.  The allure of the Outer Banks brought her back to the beach and she resumed her career in real estate sales.  She quickly became a top producer and attributes her success to hard work, discipline and in-depth knowledge of the local market.  Along with her successful career in real estate sales, Ilona also offers training and coaching to the sales team at Beach Realty & Construction.

You can reach Ilona Matteson in the Duck office of Beach Realty & Construction/ Kitty Hawk Rentals at (252) 261-6600 or email [email protected].


Beach Realty & Construction/Kitty Hawk Rentals is a full-service real estate company offering an attractive and ethical environment for licensed real estate professionals to realize a successful career.  For more information about joining the Beach Realty sales team contact Sales Manager, Beth Urch at (252) 261-3815 or [email protected].  

The 2015 Outer Banks Market Report

We saw a lot of very positive signs in 2015 that continue to lead us on the path to recovery.  While we still have an oversupply of inventory on the market, keeping prices down, we have a double digit increase in number of sales.

The other interesting trend is showing more homes in the higher price ranges are selling and fewer homes offered in the under $300,000 price range.  That is showing our median sales price to be up, even though individual home prices aren’t rising at this point.

It’s virtually impossible for our home values to go up when inventory is still at a 15 month supply.  However, it’s a great step forward.  We saw a 20% increase in number of sales for 2012, then it steadied for 2 years until another big increase in sales for 2015.

Mortgage brokers are expecting a surge in activity the first part of 2016 to beat the Fed’s promise of rising interest rates.  We certainly have a year round market on the OBX and see great activity all year long.  The two spikes in activity happen in March/April and September/October.  No need to wait though, we can get your home sold any time of year.

Here is the breakdown of where we ended up for 2015:

  • Residential number of sales were up 11%
  • Average sales price was down 2%
  • Land sales numbers were down 5%
  • Average sales price was up 7%
  • Inventory was down 8%, being the lowest since 2007
  • Foreclosed home sales were down 37%

Next month I’ll provide a break down of each location individually so you can see how it compares year over year.

If you have any questions or would like additional information please let me know.

  • This field is for validation purposes and should be left unchanged.

Currituck County’s PRELIMINARY Updated Flood Maps

The following information is copied with permission from the Outer Banks Association of REALTORS(R) .

Currituck County’s PRELIMINARY updated flood maps have been released. Information pdf on how to access the site. The link will take you to the flood map FRIS page, click on ok and then select the County (Currituck).In the upper right corner you will see “effective”. Go there and select “preliminary”. You will be able to look at the new proposed maps that will hopefully be adopted within the next year.

If you zoom in, you will start to see aerial views. By clicking on the map in a particular area you will get the information on the right side of the screen or you can search by using magnifying glass on menu at top left. Most of our county is seeing a significant change to elevations being lowered and many homes will come out of the flood zones or be classified into a lower zone (VE to AE for an example According to the NC Floodplain Mapping Office, the preliminary maps show that Currituck County has 11.5 square miles of V Zone (89.5% decrease from current maps) and 249.5 square miles of A Zone (24.75% increase):

  • ‪Under current mapping, there are 1,097 buildings in the V Zone; new maps show 126 buildings in the V Zone;
  • ‪Current maps show 7,020 buildings in the A Zone; new maps show 2,767 buildings the A Zone.

There are oceanfront V Zone properties that are coming completely out of the special flood hazard area – being changed to an X Zone!

Please keep in mind that these are only preliminary maps. They will have to undergo a 90-day appeal process, a public meeting process and final FEMA approval. This entire process could take up to 18 months. In the meantime –  good news overall for homeowners in the special flood hazard area!

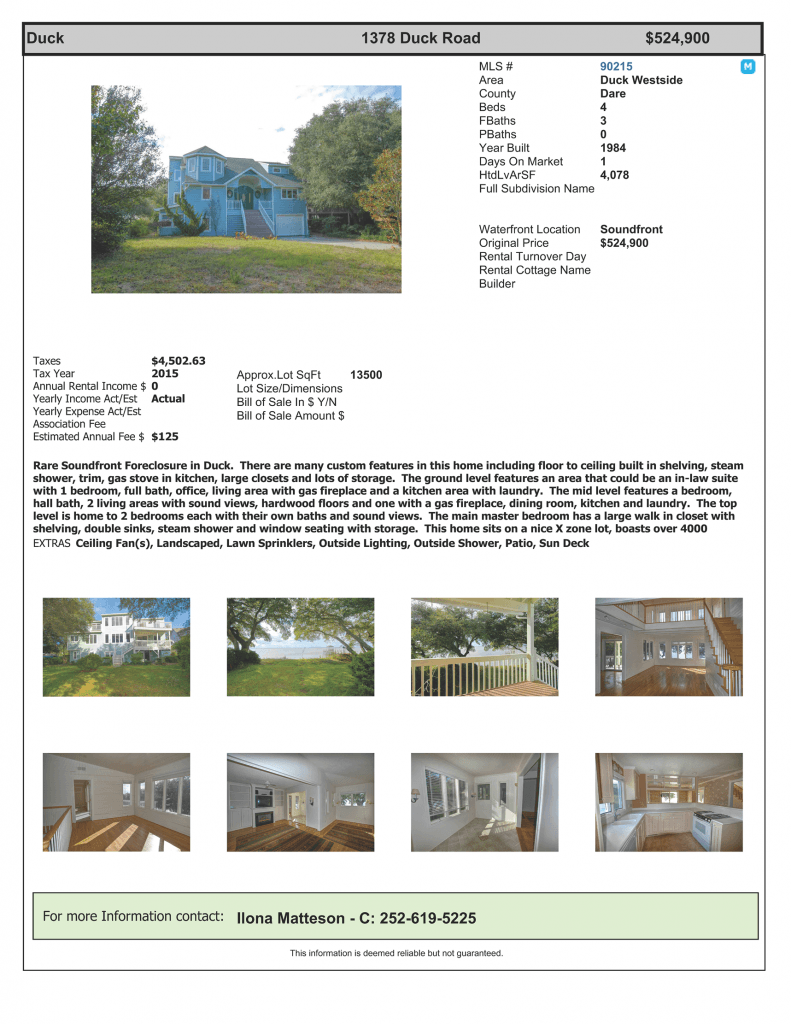
1378 Duck Road, Duck, NC 27949

1378 Duck Road info

Call me today!!

  • This field is for validation purposes and should be left unchanged.

November Outer Banks Market Report       

It’s still 70 degrees here in Corolla today!  Almost mid November and it’s very warm.  Also SMOKING HOT is real estate market activity!  Pending sales are up 56% from last year.  That means there are more properties under contract right now than this same time last year.

However, most importantly to note, prices are NOT up.  In fact in some markets, like Corolla, they have still declined.  Other areas remain virtually unchanged.  So we are selling more houses for the same or less money.  That’s not a terrible thing, because it means we are stabilizing.  That’s a good sign, since it’s a necessary part of a recovery.

Let’s remember, the majority of home sales on the Outer Banks are to buyers who don’t live here.  That means it is a discretionary purchase, which will cause our recovery to naturally be slower than those year round markets.  This is nothing new.  The same thing happened when the real estate market crashed in the late 80’s.  It was almost 1999 before things recovered.

Distressed property sales are down 30% from last year.  So the truth is those sales are no longer a factor and are certainly not what’s holding back prices.  The main issue is STILL supply and demand.  We have a whopping 16 months worth of inventory on the market right now.

That means if nothing new came on the market it would take 16 months to sell out what’s currently for sale.  A normal market is considered to be a 4 to 6 month supply.  Since we are selling more than last year and this “16 months” is the lowest absorption rate we’ve seen in many years, I would say this is another great sign that we are getting close to the end of the stagnant time.

The important thing to remember is, prices won’t immediately start to go up either.  Appreciation takes time.  So if your home is worth 15% to 20% less than what you would prefer to sell it for in today’s market, you could still be another 6 or more years away from getting your preferred price.  And we don’t know what an interest rate hike could do to that time frame either.  That kind of increase in value will take time, as it should, or we will only be setting ourselves up for another crash.  Which I’m sure, nobody wants to experience again this soon if at all!

That being said, if you want to buy a great house, it may not last long.  Especially if the home is priced right.  If you want to sell your home, price it aggressively and the buyers will show up!