2017 Outer Banks Market Report

The buzz around town is that 2017 was a banner year for sales. So, is it true? The
answer is not a simple yes or no. There are many facets that impact a real estate
market.
The truth is, it depends on which side of the fence you’re on as to how you’ll measure the
market activity. Let’s look at the 5 ingredients of a market, in what I would consider
the order of importance:
1. Price – This of course, is the top concern for buyers and sellers. The
definition of a good market to a seller will usually come down to what
price they can get for their home.
2. Inventory – This is truly the one factor that can make or break a market.
Inventory controls price. We all know the principle of supply and
demand and how that impacts the value of a home.
3. Activity – The number of properties sold annually is a major factor and is
dependent on the previous two factors. If no one is buying, it keeps
inventory high and prices very low. We have two main markets on the
OBX (Duck and Corolla) where the sales that take place are 100%
discretionary. With no primary market forcing sales to take place, this is
keeping the inventory at high levels.
4. Interest Rate – Rising or falling interest rates impact the buyer’s
purchasing power. We are still experiencing very low rates, for now. All
signs point to some increase this year.
5. Buying Trends – This factor is the one least considered by sellers,
mistakenly. Especially in a resort market. Most sellers assume the
buyers are going through the same thought process they did when
buying. That simply isn’t true. Today, buyers place the most weight in
their decision on condition. After 20 years in the business, this is
definitely a shift in process.

So how did the Outer Banks fare in 2017 relative to each of these 5 categories?
1. Price in most locations has not changed. There is still no area with any
measurable appreciation and some areas (Duck and Corolla) are still
subject to some minor depreciation due to continued high inventory
levels.
2. Inventory is on the decline. In 2017 we had the lowest monthly inventory
levels since 2010. That is excellent news and a great sign of continued
recovery for our market.
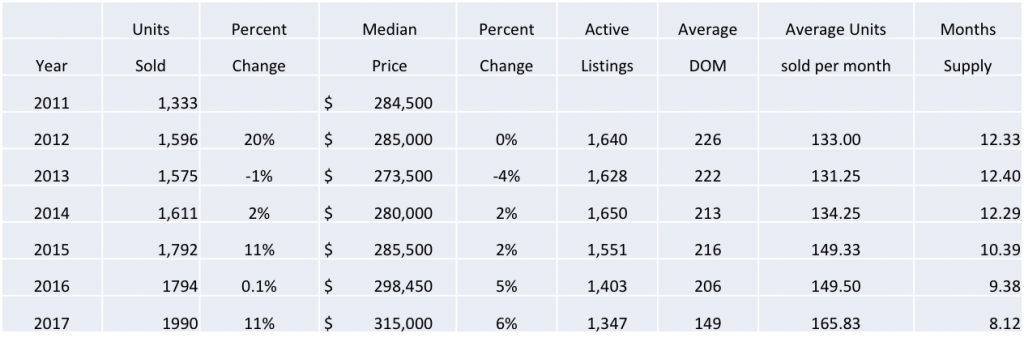
3. Activity was up over 2016. Like any market we experience cycles. Any
time there is a double digit increase in sales, the next 3 to 4 years become
a little stagnant. That’s just how markets cycle. When you hear that the
OBX market was on fire last year, this is likely the aspect one was
referring to. This increase in activity really helped lower the Days on Market.                                 However, pricing for the market is the greatest contributor to that.

Year                    2012      2013      2014       2015       2016      2017
Total # Sold      2042      2093     2139      2292      2289      2560
Increase from
Previous Year    21%         2%        2%           7%         0%        11%

4. Interest Rates remained steady between 4% and 4.25%. Your guess is as
good as mine as far as what will happen with that this year. Stock market
gains are making it easier to diversify and invest in real estate.
5. More homes were passed up in 2017 because of outdated condition than
any other reason. If you want to sell quickly, you’ll either need to price
your home for it’s condition or invest in a few upgrades.

If you’d like more information on buying or selling this spring, contact me for more
information.

December 2017 OBX Market Update

Sales and Under Contract Properties


Our positive sales continue with single family residential sales units remaining up 14% YTD 2017 over 2016 and the corresponding dollar volume is up 17%.   

Residential land sales, YTD 2017 over 2016, are up 11% in units and up 3% in dollar volume.  The median sales price is up 1% year over year.

Inventory


Currently the market sits at about 10 months worth of residential inventory. This is a very encouraging sign and is a combination of strong sales and lower inventory levels.  It is EXTREMELY important to remember that this varies GREATLY by area and town.  We still have some areas that are not experiencing these results.  It is important to understand what the number is for your area.

New inventory that came on the market in November was up 2% from November 2016.  

Average days on market for SOLD single family residential YTD 2017 is 152, down from 208 days in 2016!  Average days on market for all current active single family residential listings remains at 215 days. 

Distressed residential properties comprise 6% of sales YTD which is flat to 2016.  Distressed listings currently comprise only 1.5% of active inventory.

Pricing

Single family residential median sale price YTD 2017 is $323,000, which is up 3% over the year prior.

This data here represents the percentage of total homes sold in each respective year relative to the sales price range. When we see an increase in median price, it can sometimes be just more sales occurring in one price range versus an actual increase in price. I think for 2017, both are actually true. We did see actual appreciation in two markets. Kill Devil Hills Between the Highways as well as Kill Devil Hills Westside.

 Price Category                     YTD 2016      YTD 2017
Below $199,999                               14%                  13%
$200,000 – $499,999                    68%                 66%
$500,000 – $749,999                     11%                  14%
$750,000 – $999,999                      4%                   4%

$1,000,000 and up                           4%                   4%

Area Median Price % Change YTD       

2017 to 2016

Units Sold %

Change YTD           

2017 to 2016

Corolla $476,250 +12% +5%
Duck $465,500 +6% +30%
Southern Shores $422,500 +6% +23%
Kitty Hawk $307,500 –% +3%
Colington $252,500 +8% +9%
Kill Devil Hills $275,750 +4% +5%
Nags Head $380,000 -1% +20%
Hatteras Island $300,000 +12% +12%
Roanoke Island $281,880 +7% -10%


National Flood Insurance Program Proposed Changes

The following is reprinted with permission from the Outer Banks Association of Realtors.

NAR Addresses Concerns About Flood Insurance Reform Bill

The National Association of Realtors sent out the following information today regarding their Call for Action last week on HR 2874 – 21st Century Flood Reform Act:

NAR has fielded many calls and emails with concerns about the bill’s impact on current and future NFIP policyholders.

The National Flood Insurance Program (NFIP) provides necessary flood protection and coverage for 5 million policyholders across 22,000 communities nationwide. However, the NFIP is currently running a $1.4 billion annual deficit, and accumulated a $24.6 billion debt after weathering a series of catastrophic loss years since 2005. These numbers do not include expected claims from Hurricane Harvey. The program is up for reauthorization on September 30th.

NAR urges the House of Representatives to bring up and pass HR 2874: The 21st Century Flood Reform Act upon returning in early September. The bill meets all six of NAR’s reform principles. It would reauthorize the program for 5 years, stabilize its financial position, and make numerous and significant improvements to current law. Following are NAR responses to questions about the bill.

FREQUENTLY ASKED QUESTIONS

Why should Congress pass The 21st Century Flood Reform Act?

• Reauthorizes the NFIP for 5 years;

• Limits maximum flood insurance premiums to no more than $10,000 per year for residential properties;

• Preserves the practice of grandfathering for remapped property owners who build to code;

• Removes hurdles to the private flood insurance market, which often offers better coverage at lower cost than the NFIP;

• Authorizes $1 billion in pre-flood mitigation assistance grants to elevate, flood proof, buyout or mitigate high risk properties;

• Doubles increased cost of compliance (ICC) coverage in the NFIP policy so policyholders can obtain up to $60,000 for property mitigation and access these funds before the property floods;

• Better aligns NFIP rates to the risk, particularly for lower risk and lower value properties inland of the coast;

• Enables more communities to develop alternative flood maps like North Carolina’s, which are more accurate than FEMA’s, and generally streamlines the map appeals process;

• Improves the claims process in light of problems experienced after Superstorm Sandy;

• Addresses issues with repeatedly flooding properties that account for 2 percent of NFIP policies but 25 percent of the claim payments over the history of the program; and

• Overall strengthens the solvency of the program over the long term.

Why not just reauthorize the NFIP without major reforms?

As currently structured, NFIP is unsustainable over the long term. According to the Congressional Budget Office (CBO),

• NFIP premiums fall $1.4 billion short of expected annual costs, including all potential flood events, not just the ones FEMA counts.

• As of March 2017, the NFIP has borrowed $24.6 billion to make claim payments for hurricanes in 2005 (Katrina) and 2012 (Sandy), and inland flooding (Baton Rouge) in 2016.

• According to the CBO, the program is expected to borrow at least another $1 billion over the next 10 years and there is only $5 billion left on its borrowing authority (just over $30 billion). These numbers do not account for claims expected to result from Hurricane Harvey.

• The NFIP is not able to repay the $25 billion already borrowed and is making interest-only payments.

• Interest on the debt costs NFIP policyholders $300 million per year — funds not available for other purposes including paying claims or improving flood mapping.

• Approximately 25 percent of NFIP policies are subsidized and paying rates below full cost.

• Less than 2 percent of 5 million policyholders flood repeatedly (two or more times) but account for more than $8 billion or 25 percent of the claims and one-third of NFIP’s $25 billion debt;

• Because NFIP sets national average rates, many lower risk or lower value properties, especially those inland of the coast, are overcharged for flood insurance while others are undercharged.

Will NFIP rates increase under the bill?

While the majority of policyholders are expected to see no change or a small rate decrease, the highest risk and highest value properties, particularly those that flood repeatedly, could see an increase. However, increases would be phased-in gradually over many years. Increases are capped at 15% a year under the bill. The bill also includes a new cap on premiums so no homeowner would pay more than $10,000 per year maximum for flood insurance.

Additionally, more than $1 billion in mitigation grant dollars is set aside under the bill for property owners to elevate, flood proof, buy out or relocate, and thereby reduce their risk-based NFIP rate. Elevating a home by just two feet can cut the NFIP rate by as much as two thirds.

What does Section 104 (coastal and inland locations for NFIP rates) do?

This provision would direct FEMA to develop NFIP rates for coastal and riverine areas, and inland.

Currently, NFIP has two risk-based rate tables – one for properties subject to more than 3 feet of storm surge (V zones) and one for everyone else (A zones). According to the CBO, this means that “owners of homes that are subject to [up to 3 feet of] wave damage from storm surge do not pay higher premiums that reflect additional risk; instead, they pay according to the same rate schedule that is used for homes that are not exposed to wave damage. The result is an implicit cross-subsidy from inland homes to coastal homes…”

By developing inland rates for coastal properties and considering such risk factors as “distance to coast,” NFIP would move toward a more granular rating system like an insurance company’s. This means that rates would generally decline with the risk as one gets further away from the coast, and vice versa. In many cases, coastal properties not subject to storm surge risk could pay less. It would also mean that homeowners in Winslow, AZ, would not pay the same rate as those just blocks away from the coast in Miami, FL. However, under this provision, increases would be subject to annual limitations so no homeowner could pay more than a 15-percent increase in any given year (down from the current law of 18 percent) or $10,000 maximum.

NAR policy supports fair flood insurance premiums, which reduce cross subsidies and better aligns with property specific risk. NAR specifically requested that section 104 be added based on an NAR-sponsored Milliman actuarial analysis of the NFIP. This study found that inland policyholders in counties including Pinellas, FL, could pay thousands of dollars too much for flood insurance while others closer to the coast pay thousands less. Milliman has recently been hired by NFIP to explore a redesign of its risk rating structure, so the NAR analysis could help illustrate the potential benefits and costs of such a provision.

What about Section 504 (repetitive loss properties)?

Section 504 would address the 90,000 structures — 2 percent of 5 million NFIP policies — that have repeatedly flooded two or more times and received more than $8 billion in claim payments since 1978. According to a Natural Resources Defense Council (NRDC) analysis of FEMA data, these properties have received an average of five claim payments totaling $181,000, and 75 percent have not taken any action to mitigate the risk of further claims.

Under the Biggert-Waters Act, NFIP rates increase 25 percent per year for repetitive losses that are “severe.” However, the majority of these properties have avoided the 25-percent increases by either filing numerous smaller claims (so no four exceed $5,000) or just two claims averaging $55,000 each but amounting to just under the value of the structure. If rates do not increase with claims, there is less incentive to mitigate and the program becomes more expensive for other policyholders. Also, because of the flawed Biggert-Waters definition, many of these property owners would not qualify for FEMA mitigation grants — even if they wanted to reduce their risk of flooding.

Section 504 would close the loopholes and make mitigation grant assistance available by redefining the term “repetitive loss” simply as “two or more claim payments of any amount.” However, no one would see a rate increase under the bill unless/until the property owner receives at least three claim payments, including at least one after the date of enactment. The bill would also reset the property’s claim status if mitigated, so no claims made prior to mitigation are counted. If a property owner nevertheless decides to file more claims without mitigating, their NFIP rate would begin to increase 15 percent per year – increases already allowed under current law — until reaching full risk. This is less than the 25-percent increases for second home and business owners but higher than the 6.5-percent increases for primary residences with zero claims.

By redefining repetitive loss as two or more payments, section 504 would also make all repetitive loss properties eligible for both flood mitigation assistance and increased cost of compliance, and set aside more than $1 billion in grant dollars. The bill removes paperwork, red tape and bureaucracy so FEMA can directly provide or expedite these grants to the owners, and waives NFIP’s current cost sharing requirement, i.e., repetitive loss properties will no longer have to pay 10 percent of the cost in order to receive a FEMA grant.

Does section 504 apply to any two claims of any amount?

No, Section 504 would apply only if there are three claim payouts – either two in the past and one in the future, or one in the past and two in the future. It is not “any claim of any amount;” it is any claim payment of any amount that exceeds the policy’s deductible. Deductibles for homeowners can range from $1,000-$10,000 so any claim for less than this would not count toward Section 504.

While the bill language is less clear on what happens to future repetitive loss properties with zero past claims, the bill sponsors’ intent is at least three claim payments before the section applies. NAR is working with the sponsors to tighten the language so there is no room for interpretation.

Would the NFIP rate go to full risk upon the second claim?

No, the property owner must file at least one more claim in the future before any premium changes take effect. The owner would also have access to grants and an opportunity to wipe the slate clean via mitigation. If the owner however chooses to file more claims before mitigating, the NFIP rate would begin to rise 15 percent per year until the owner pays full risk. The rate could not exceed $10,000 per year for residential properties.

Will repetitive loss properties lose their grandfathered status?

NAR supports grandfathering for property owners who build to code. According to FEMA, most repeatedly flooding properties were built before there were flood maps or codes (i.e., pre-FIRM). Moreover, the vast majority have been substantially flood damaged (i.e., damage exceeds 50% of the building’s value), which would render them not eligible for grandfathering under current law.

In fact, this bill would enable repetitive loss property owners to grandfather, not the reverse. Under the bill, if an owner mitigates to code, the property’s status would reset so it could grandfather to the map at the time of mitigation when that map is updated in the future.

Do repetitive loss properties lose pre-FIRM subsidies?

Pre-FIRM subsidies are already being phased out under current law; section 504 would not change this. Under the legislation, NFIP rates for severe repetitive loss properties, non-primary residences and business properties will continue to increase 25 percent per year until reaching full risk (same as current law); the primary residences will increase 6.5 percent. What section 504 does is raise the rate to 15 percent per year (instead of 6.5 percent) if a primary homeowner receives at least three claim payments, including at least one after bill signing.

Would the bill eliminate NFIP coverage for repetitive loss properties?

Only for the most extreme repetitive or excessive lifetime loss claims.

• Section 504 would discontinue NFIP coverage if a repetitive loss property submits at least three claims, the sum of all claim payments exceeds 1.5 times the NFIP’s coverage limit for structure ($525,000 for a residential property), and the owner refuse to mitigate.

• Section 505 would discontinue coverage if the sum of all claim payments received in the future (beginning 18 months after bill signing) exceeds 2 times the value of the building (e.g., if a $500k structure cumulatively receives more than $1 million in NFIP payments for floods after 2020).

It is unlikely that any property owner would choose to file additional claims knowing that the next one would trigger either of these thresholds and force the NFIP to drop coverage.

Why are these changes necessary?

As currently structured, the NFIP is not sustainable over the long run. While the bill does make some difficult choices, the changes are the minimum necessary to close the $1.4 billion shortfall between premiums and claims. The bill could have gone farther to address the $25 billion debt but did not. Sacrifices are shared by policyholders over time so no one group would bear the full burden. Does this mean that a handful of policyholders might see higher rates? Yes. Does this bill provide financial and mitigation assistance for those who could be hardest hit? Yes. If the program is reauthorized without major reforms, will there continue to be an NFIP in the future? There are no guarantees.

The bill in its entirety can be found here.

September 2017 OBX Market Update

We had a mild August for weather, not for real estate sales.  With interest rates still very low and activity increasing, we fully expect a great fall market.

Here are the main highlights:

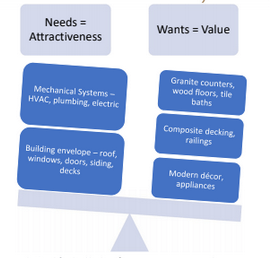
  • Condition – Buyers are becoming more and more selective about the condition of the homes they buy. Their expectation is to have the updates and upgrades already done.  Updates = recent roof, windows, doors, siding, paint, HVAC.  Upgrades include granite counters, stainless appliances, tile or hardwood floors, cabinets in kitchen and bath.  It’s clear, do the updates/upgrades or drop the price.
  • Homes listed and sold since January 2017 are going in only 45 days. Many with multiple offers.  Buyers have been watching the market for years.  They know when a house comes on the market at the right price and they are ready to act.
  • Residential inventory is down by 8%. This is a nice continuation of what is needed to stabilize the market in Duck and Corolla.  Because those areas are primarily second homes, the inventory has been stuck very high.  That has been putting more pressure on lowering prices.  We are slowly getting there, yet still a year or two away.
  • Distress sales made up 2% of all sales for our local market. That makes these sales a complete non-issue as that is a normal amount for any market.
  • So far this year 18 more homes have sold in Corolla than last year (an increase of 10%). In Duck there were 34 more homes sold this year, up 38%.  Overall the entire market is up by 11% (1310 homes sold 2017 vs 1176 in 2016)

If you have any questions about buying or selling on the Outer Banks, please contact me.

July 2017 OBX Market Update

Here are the highlights:

  • Total Sales: Total June sales – 279 Units – the highest monthly number of units sold since October 2005. Total Volume Sold – $427,942,964.
  • Under-contract: Units listed as under contract declined by 11% due to the record number of closings in June and the normal seasonal decline; however, with 410 units still listed under contract, the July sales figures should be noteworthy.
  • New Construction: As of May 2017, the number of new construction building permits were down 7% from 2016 (112 units vs 121 units). Building permit value was down by 3%. Quite a change from last month.
  • Days on the Market: For all residential properties listed in the MLS, the average Days on the Market was up slightly (3%) but down by 24% when compared with June 2016.
  • How Sold: In our market, 66% of all loans are conventional loans, 20% are cash, 6% are VA, 4% are FHA, 3% are Jumbo. USDAA and Other account for the remaining loans.
  • Distressed Sales: Distressed sales declined by 2% in June and accounted for just 5% of the total.
  • Inventories: Residential inventory was down by 13% in June. Lots / Land inventory was down by 16% in June.

*This information is reprinted with permission from the Outer Banks Association of REALTORS

Let’s break it down by area and price range: (Data through July 15)

Corolla

$200,000 – $400,000                               $401,000 – $600,000

46 for sale                                                      81 for sale

49 sold YTD                                                   51 sold YTD

7.5 buyers each month                                8 buyers each month

6 months of inventory                                 10 months of inventory

8 U/C currently                                             16 U/C currently

128 Days on Market                                     198 Days on Market


$601,000 – $800,000                               $801,000 – $1,000,000

53 for sale                                                      27 for sale

20 sold YTD                                                   7 sold YTD

3 buyers each month                                   1 buyer each month

18 months of inventory                               27 months of inventory

5 U/C currently                                             3 U/C currently

92 Days on Market                                       137 Days on Market


$1,000,000 – up

66 for sale

16 sold YTD

2 buyers each month

33 months of inventory

4 U/C Currently

102 Days on Market


Duck

$200,000 – $400,000                               $401,000 – $600,000

9 for sale                                                        33 for sale

9 sold YTD                                                     26 sold YTD

1.3 buyers per month                                   4 buyers per month

7 months of inventory                                  8.25 months of inventory

2 U/C currently                                             6 U/C Currently

133 Days on Market                                     120 Days on Market


$601,000 – $800,000                               $801,000 – $1,000,000

23 for sale                                                      20 for sale

9 sold YTD                                                     9 sold

1.3 buyer each month                                  1.3 buyers each month

17 months of inventory                               15 months of inventory

4 U/C Currently                                            2 U/C currently

81 Days on Market                                       149 Days on Market


$1,000,000 – up

27 for sale

7 sold YTD

1 buyers per month

27 months of inventory

2 U/C currently

186 Days on Market


Southern Shores

$200,000 – $400,000                              $401,000 – $600,000

15 for sale                                                      29 for sale

21 sold YTD                                                   18 sold YTD

3 buyers each month                                   2.7 buyers each month

5 months of inventory                                 11 months of inventory

4 U/C currently                                             4 U/C currently

72 Days on Market                                       94 Days on Market


$601,000 – $800,000                                $801,000 – $1,000,000

12 Active                                                        8 Active

4 sold YTD                                                     2 sold YTD

.6 buyers each month                                 .3 buyers each month

20 months of inventory                              26 months of inventory

1 U/C currently                                             1 U/C currently

259 Days on Market                                     74 Days on Market


$1,000,000 – up

12 Active

1 sold YTD

2 U/C currently

361 Days on Market


June 2017 Market Update

The trend of big activity is continuing for our market.  Recent news of the Fed raising the Prime Rate to 4.25% could cause our summer market to be busier than normal as people make the decision to buy before the long term rates are affected, possibly going up as high as 6%, according to history.


Here are the highlights:

  • Total Sales: Total sales (245 Units) for May are at their highest level since January 2005. Additionally, the total volume sold is at its highest level since 2005 (>$80 million).
  • Under-contract – Units listed as under contract declined by 3% due to the record number of unit sales in May and the normal seasonal decline; however, with 461 units currently listed as being under contract, June sales should also be impressive.
  • New Construction: As of April 2017, the number of new construction building permits were down 32% compared to last year and total building permit value was down 47%.
  • Days on the Market: For all residential properties listed in the MLS, the average Days on the Market has dropped dramatically to 135 days; however, when looking at just properties listed in the MLS since January (1488 units) the average Days on the Market calculation drops to 57.
  • How Sold: In our market, 58% of all sales use conventional loans, 22% are cash, 8% are VA, 5% are FHA, 3% are jumbo. USDAA and Other account for the remaining loans (4%).
  • Distressed Sales: After experiencing a steady decline for years, Bank Owned property sales were up 18% in May. Short sales continue their downward decline and are down by 7%.
  • Inventories: Housing inventory was down by 8% in May.

*This information is reprinted with permission from the Outer Banks Association of REALTORS

Let’s break it down by area and price range:

Corolla                                                            

$200,000 – $400,000                                   $401,000 – $600,000

51 for sale                                                         93 for sale

43 sold YTD                                                     43 sold YTD

8 buyers each month                                      8 buyers each month

6 months of inventory                                   11.6 months of inventory

9 U/C currently                                               7 U/C currently

114 Days on Market                                        144 Days on Market


$601,000 – $800,000                                   $801,000 – $1,000,000

54 for sale                                                         27 for sale

14 sold YTD                                                      6 sold YTD

2.5 buyers each month                                   1 buyers each month

21.6 months of inventory                               27 months of inventory

9 U/C currently                                               3 U/C currently

114 Days on Market                                        134 Days on Market


$1,000,000 – up

71 for sale

15 sold YTD

2.7 buyers each month

26 months of inventory

2 U/C Currently

161 Days on Market


Duck

$200,000 – $400,000                                   $401,000 – $600,000

10 for sale                                                         34 for sale

9 sold YTD                                                       23 sold YTD

1.5 buyers per month                                     4 buyers per month

6.6 months of inventory                                 8.5 months of inventory

1 U/C currently                                                 4 U/C Currently

125 Days on Market                                        94 Days on Market


$601,000 – $800,000                                   $801,000 – $1,000,000

27 for sale                                                         21 for sale

9 sold YTD                                                       8 sold

1.6 buyer each month                                     1.5 buyers each month

17 months of inventory                                  14 months of inventory

4 U/C Currently                                               1 U/C currently

81 Days on Market                                          139 Days on Market


$1,000,000 – up

31 for sale

6 sold YTD

1 buyers per month

31 months of inventory

2 U/C currently

186 Days on Market


Southern Shores

$200,000 – $400,000                                  $401,000 – $600,000

11 for sale                                                         31 for sale

14 sold YTD                                                     15 sold YTD

2.5 buyers each month                                   2.7 buyers each month

4 months of inventory                                   11 months of inventory

10 U/C currently                                             9 U/C currently

73 Days on Market                                          94 Days on Market


$601,000 – $800,000                                   $801,000 – $1,000,000

10 Active                                                            8 Active

3 sold YTD                                                         2 sold YTD

.5 buyers each month                                     .36 buyers each month

20 months of inventory                                  22 months of inventory

3 U/C currently                                                0 U/C currently

243 Days on Market                                        169 Days on Market


$1,000,000 – up

13 Active

1 sold YTD

0 U/C currently

547 Days on Market

May 2017 Outer Banks Market Update

The following is a summary of the Outer Banks market as a whole, reported by the Outer Banks Association of REALTORS and reprinted with permission.

  • Total Existing-Home Sales: Existing home unit sales are up 19% compared to 2016.
  • Under-contract – With 473 units in an under-contract status, sales in May should rise dramatically.
  • New Construction: New Construction building permits are down 31% compared to last year and total building permit value is down 20%.
  • Days on the Market: For all residential properties listed in the MLS, the average Days on the Market was 162 days; however, when looking at only the residential properties listed on the MLS since January 1, 2017 (1157 units), the average days on the market was 50 days.
  • All-cash Sales: Nationally, 23% of all home sales are for cash. Locally, we are also selling at the national average.
  • Distressed Sales: Bank Owned properties and short sales made up 7% of all residential property sales in in April. So far, this year, short sales are down by 25% and bank owned sales are up 19%.
  • Inventories: Housing inventory was down by 15% in April.

What are the clear bright spots in this report?  Inventory is down, which is desperately needed.  And, those sellers willing to price the home in today’s market are rewarded with a fast sale.

Remember, most buyers will spend 12 to 18 months looking around before purchasing a second home.  So they know what a good value is.  When it hits the market, they are ready to move!  They are also ready to pay close to the asking price.

So what does this mean for your home’s value?  The areas of Corolla and Duck are still quite a mess.  Southern Shores is doing somewhat better.

The data below that indicates for each price range the following:

  • How many homes are for sale in that range
  • How many have sold this year
  • Divided by 5.5 months = how many buyers are available in that range each month
  • Divided by the number for sale = the months of remaining inventory for that price range
  • How many homes are under contract, scheduled to close
  • The median days on market for homes sold in that price range

Corolla                                                            

$200,000 – $400,000                                       $401,000 – $600,000

41 for sale                                                              81 for sale

30 sold YTD                                                          28 sold YTD

5.5 buyers each month                                        5 buyers each month

7.5 months of inventory                                      16 months of inventory

10 U/C currently                                                   19 U/C currently

234 Days on Market                                             229 Days on Market


$601,000 – $800,000                                       $801,000 – $1,000,000

60 for sale                                                             29 for sale

10 sold YTD                                                           4 sold YTD

1.8 buyers each month                                        .7 buyers each month

33 months of inventory                                       41 months of inventory

8 U/C currently                                                     3 U/C currently

90 Days on Market                                               166 Days on Market


$1,000,000 – up

75 for sale

9 sold YTD

1.6 buyers each month

47 months of inventory

8 U/C Currently

113 Days on Market


Duck

$200,000 – $400,000                                       $401,000 – $600,000

8 for sale                                                               36 for sale

8 sold YTD                                                            19 sold YTD

1.5 buyers per month                                          3.5 buyers per month

5 months of inventory                                        10 months of inventory

2 U/C currently                                                    4 U/C Currently

155 Days on Market                                             109 Days on Market


$601,000 – $800,000                                       $801,000 – $1,000,000

30 for sale                                                             21 for sale

6 sold YTD                                                            8 sold

1 buyer each month                                             1.5 buyers each month

30 months of inventory                                      14 months of inventory

3 U/C Currently                                                    1 U/C currently

87 Days on Market                                               149 Days on Market


$1,000,000 – up

32 for sale

3 sold YTD

.5 buyers per month

64 months of inventory

3 U/C currently

178 Days on Market


Southern Shores

$200,000 – $400,000                                       $401,000 – $600,000

14 for sale                                                              32 for sale

10 sold YTD                                                          11 sold YTD

1.8 buyers each month                                        2 buyers each month

7.7 months of inventory                                      16 months of inventory

7 U/C currently                                                     5 U/C currently

105 Days on Market                                             99 Days on Market


$601,000 – $800,000                                       $801,000 – $1,000,000

12 Active                                                                6 Active

3 sold YTD                                                            2 sold YTD

.5 buyers each month                                         .36 buyers each month

24 months of inventory                                      16 months of inventory

1 U/C currently                                                     1 U/C currently

254 Days on Market                                            115 Days on Market


$1,000,000 – up

12 Active

1 sold YTD

0 U/C currently

547 Days on Market


Dare County Flood Map Update

The following is reprinted with permission from the Outer Banks Association of REALTORS®

Dare County Flood Map Update – IMPORTANT INFO

Dare County and its six towns have been working on how to respond to the preliminary flood maps that were released last June. While it looks like an appeal of the maps will not happen, there is ongoing conversation about developing local elevation standards for development and re-development purposes. The maps, when effective, would then only be used for flood insurance rating purposes.

Approximately 75% of Dare County properties currently in a special flood hazard area and required to carry flood insurance are coming out of the special flood hazard area altogether under the preliminary maps. The preliminary maps show some properties that are currently zoned in a VE – highest risk flood zone on the oceanfront moving into an X zone, which is out of the special flood hazard area and not required to carry flood insurance. Technically, a house could be built slab on grade in this zone. The maps, while developed using the latest, most advanced technology, do not take into consideration our high water table and heavy rains that cause flooding from standing water. They were developed to address flooding from storm surge.

OBAR and OBHBA recognize the potential of risky development when it comes to flood hazards under the new maps and have been part of the local conversations on how to move forward. The 90-day appeal process has still not yet started thus delaying the effective date of the maps even more. There is a timeline of things that need to take place before the maps become effective which now may not even be until 2019.

A meeting was held this week with Dare County Planner Donna Creef and members of the county’s Program for Public Information Committee to review and consider approaches to encourage property owners to maintain flood insurance coverage or purchase it if they have not had it. “Low Risk IS Not NO Risk”, “eXceed the X Zone”, and “LES is MORE (Local Elevation Standard) and other possible slogans for a public information flood insurance promotional campaign were discussed. The Committee also talked about how to move forward on developing elevation standards in various areas in unincorporated Dare County and how additions/remodeling/repairs might be treated.

WORD TO THE WISE: Banks are also looking at the impact of the preliminary flood maps if they become effective as presented. You may see banks imposing a flood insurance requirement to qualify for a mortgage in the future although the flood maps show the property in an X zone, where flood insurance is not mandatory. Also, be careful when advising clients as to the redevelopment potential of properties for sale based on the preliminary maps. With focus on the development of local elevation standards, creating new first/ground floor living space may still not be allowed when all is said and done.

Dare County has more information on the map process here.

April 2017 Outer Banks Market Report

There are 3 main things to pay attention in the real estate market right now.

  • We saw another rate drop today, bringing us to a new low in the last 3 months.
  • Residential home sales (actual closed deals) are up 22% over this same time last year.
  • The number of homes going under contract are also up by 22%.  The market is SUPER active right now.

The homes in the best condition with the right price are even getting multiple offers.  We are also seeing a lot of homes selling in less than a month with that same strategy.  If you’re thinking of buying or selling a home this year, contact me for a consultation.

Outer Banks Market Breakdown

Below on the left is a breakdown of activity for each town from 2013 to 2016. The % change reflects the difference between calendar year 2015 and 2106.  On the right is a breakdown of what % of closed sales were in the respective price ranges.