The 2014 Outer Banks Fall Market Forecast

 There are 5 separate aspects to this market analysis/forecast.

  1. Land Sales Data
  2. Home Sales Data
  3. Rental Report
  4. Home Starts Data
  5. Finance Market Data

The purpose of this report is to provide an accurate accounting of what is currently happening in our local market and based on factual statistics, what is most likely to happen for the remainder of the 2014 calendar year.  While we don’t have a crystal ball with markets, we do have trends.  Those trends can give a fair gauge of what decisions need to be made and when.  Let’s get started!

*The data below analyzes the difference between January 1, 2013 to August 1, 2013 and the same time frame for 2014. 

Part 1 – Land Sales Data

Corolla

2013                                  2014

Total Sold –                    69                                        22                         (68% drop)

Avg Days on Mkt –      273                                     266

Avg List Price –             $300,000                         $258,000          (14% drop)

Avg Sold Price –            $272,000                         $250,000          (8% drop)

Currently Available – 84  (28 month supply)

Average Price – $223,000

Duck

2013                                  2014

Total Sold –                    4                                          4

Avg Days on Mkt –      267                                     1010

Avg List Price –             $370,000                         $349,000          (6% drop)

Avg Sold Price –            $320,000                         $311,000          (3% drop)

Currently Available – 27  (47 month supply)

Average Price $296,000

Southern Shores

2013                                  2014

Total Sold –                    10                                        21                         (52% increase)

Avg Days on Mkt –      454                                     384

Avg List Price –             $185,000                         $249,000          (26% increase)

Avg Sold Price –            $171,000                         $193,000          (11% increase)

Currently Available – 31  (10 month supply)

Average Price $181,000

Southern Beaches (KH, KDH, NH)

2013                                  2014

Total Sold –                    50                                        49

Avg Days on Mkt –      266                                     304

Avg List Price –             $130,000                         $161,000          (19% increase)

Avg Sold Price –            $113,000                         $143,000          (21% increase)

Currently Available – 147  (21 month supply)

Average Price $290,000  (This includes 7 oceanfront lots for sale over $1,000,000)

Final Analysis

  • Land is a better value in Corolla
  • Southern Shores has the lowest supply of inventory relative to the number of buyers
  • Duck is the most expensive location with the most supply available
  • Unless your price is super aggressive, you can expect it to take almost a year to sell a vacant lot

Top Prediction – Land sales will continue to stay low due to the greater availability of larger homes at lower prices (higher end properties cannot be rebuilt new for the same price as an existing home at today’s lower prices).

Part 2 – Homes Sales Data

Corolla

2013                                  2014

Total Sold –                    107                                     91                         (15% drop)

Avg Days on Mkt –      261                                     254

Avg List Price –             $672,000                         $741,000          (9% increase)

Avg Sold Price –            $627,000                         $698,000          (10% increase)

List to Sale % –             93%                                   94%

Currently Available – 360  (28 month supply)

Average Price – $750,000

Breakdown of Sold by Price

Under $350,000           18 (17%)                         14 (15%)

$351,000 – $500           42 (39%)                         29 (32%)

$501,000 – $700           21 (20%)                         21 (23%)

$700,000 – $1M            13 (12%)                         14 (15%)

$1M – up                          13 (12%)                         13 (15%)

While it may look like the prices in Corolla are going up, looking at the break down of price you can see that fewer homes sold in the under $350,000 range as well as 30% of homes sold were over $700,000 in 2014.  That was only 24% in 2013.  So more of the higher end homes are selling.

Duck

2013                                  2014

Total Sold –                    60                                        59

Avg Days on Mkt –      247                                     288

Avg List Price –             $723,000                         $674,000          (7% drop)

Avg Sold Price –            $665,000                         $628,000          (6% drop)

List to Sale % –             92%                                   93%

Currently Available – 150  (19 month supply)

Average Price – $706,000

Breakdown of Sold by Price

Under $350,000           12 (20%)                         19 (32%)

$351,000 – $500           17 (28%)                         8   (14%)

$501,000 – $700           15 (25%)                         11 (19%)

$700,000 – $1M            9   (15%)                         16 (27%)

$1M – up                          7   (12%)                         5   (8%)

While it may look like the prices in Duck are going down, looking at the break down of price you can see that while more homes sold in the under $350,000 range, 3 of them in 2013 were co-ownership (avg price $30,000) and in 2014 there have been 7 co-ownership sales thus far.  This is creating a small skew in the numbers.  There was a noticeable jump in sales of the $700,000 to $1M price range.

Southern Shores

2013                                  2014

Total Sold –                    42                                        59                         (29% increase)

Avg Days on Mkt –      210                                     194

Avg List Price –             $577,000                         $555,000          (4% drop)

Avg Sold Price –            $545,000                         $520,000          (5% drop)

List to Sale % –             94%                                   94%

Currently Available – 96  (12 month supply)

Average Price – $599,000

Breakdown of Sold by Price

Under $350,000           12 (29%)                         14 (24%)

$351,000 – $500           14 (32%)                         24 (41%)

$501,000 – $700           5   (12%)                         12 (20%)

$700,000 – $1M            7   (17%)                         6   (10%)

$1M – up                          4   (10%)                         3   (5%)

The best news for Southern Shores is that activity has taken a sharp turn upward.  Notice the months of supply is a year or less and the average price is under $600,000.  This time last year, $599,000 was only 12% of the price range selling there.  Today it’s 20%.  This is a location to watch!

Southern Beaches

2013                                  2014

Total Sold –                    322                                     289                      (10% drop)

Avg Days on Mkt –      211                                     184

Avg List Price –             $322,000                         $363,000          (11% increase)

Avg Sold Price –            $302,000                         $348,000          (13% increase)

List to Sale% –              94%                                   96%

Currently Available – 538  (13 month supply)

Average Price – $451,000

Breakdown of Sold by Price

Under $350,000           241 (75%)                      208 (72%)

$351,000 – $500           51 (16%)                         31 (11%)

$501,000 – $700           16 (5%)                           26 (9%)

$700,000 – $1M            7   (2%)                            15 (5%)

$1M – up                          7   (2%)                            9    (3%)

Same story in the Southern Beaches.  Fewer homes selling under $350,000 and more expensive homes selling.

Final Analysis –

  • Good news for those higher end sellers.  While your price may still be lower than you want, we have more buyers willing to spend in that price range.
  • All areas have at least a year of inventory going up to as much as over 2 years.
  • Corolla still seems to be the market with the biggest struggles
  • You can expect to sell within 93% to 97% of your asking price, ONCE THE HOME IS PRICED CORRECTLY
  • Average days on market is on average over 200 days which indicates the home goes through multiple price reductions before selling
  • The best strategy is to price the home aggressively from the start to avoid further losses

Top prediction – inventory levels being so high will continue to stifle prices.  There is still another 3 to 5 years minimum before a rise in prices of any substance can be expected.

Part 3 – Rental Report 

The following data comes from a consensus of interviews with multiple property management firms.  I have no hard data to support this information.  It’s based on several interviews conducted.

  • More weeks are 100% sold out this year than last
  • More guests are booking “pre-reservations” for the same home next year upon their departure
  • More guests are waiting until the last minute to book reservations in order to obtain a lower rental rate
  • There is a higher percentage of weeks booked at a discounted rate than in years prior
  • More damage reports are being filed
  • More complaints and overall “difficult people” were mentioned

Top Prediction – As the population of sites like hotels.com, priceline.com, etc. grows, the trend of seeing more last minute bookings and requests for a discount will rise as well.  Be prepared with your property manager to do an advertised rate and a secondary, discount rate in advance so you don’t loose a booking while the agency is trying to track you down for a decision. 

Part 4 – Home Starts Data 

This data is for Dare County only. 

2013 January to May

68 new starts

$17,900,000 volume

$263,000 average price

2014 January to May

78 new starts

$22,800,000 volume

$292,000 average price

It seems that the spike in sales of vacant lots in 2013 is parallel to the spike in new home starts for the first part of this year.  With lot sales being down drastically in 2014 it will be interesting to see the impact on new home starts for the remainder of this year.

Top Prediction – A number of spec homes were sold in the last 6 months in Kill Devil Hills Westside.  I think we will see more specs built in the lower end price range (under $350,000) as long as builders can continue to buy land under $100,000.  With fewer homes for sale under $350,000, this could be a real winner for investors. 

Part 5 – Financial Market Data

The following report is from a local lender, Drew Wright with OnQ Financial.  He can be reached at [email protected] or 252-562.0194.  He is happy to provide info on prequalification to buy or refinancing an existing loan.

Here on the Outer Banks we defy the rest of the country that typically see sales grow through the spring and into the summer. As is typical, our market slows down in the peak tourist visiting summer season. The reason is pretty simple- it is hard to show a house full of guests who want a week of uninterrupted vacation. Most rental companies and sellers are adamant about not showing a home that is occupied by guests.

I am optimistic about what we see for our upcoming fall buying season and the biggest time for new construction. Inquiries and prequalification for both purchases and new construction are steady and higher than a year ago. So what can we expect for rates over the next three to four months taking us into 2015?

First, just one year ago before the Federal Reserve announced they would begin scaling back mortgage backed bond purchases, rates were well below 4%. Closer to 3.50% to 3.75% for 30 year fixed rates. Rates quickly rose to about 4.50% and have pretty much quietly stayed in this range, until recently as they trended lower- closer to 4.25%.

Most of the experts thought rates would continue to rise for all of 2014 and by most accounts should be higher than 4.50%.  By all accounts rates probably should be headed higher but there are many head winds to rising rates. Yes, the economy disappointed for the first few months but other factors outside of the Federal Reserve control also contributed. Other parts of the world even those with growing economies are scared to death of deflation and as a result are exporting their deflation to us, therefore keeping inflation as measured by the Federal Reserve in check.

While I do believe the world economy is not as well off as ours, I do think our growth in the second half looks to be impressive with job creation above 200,000 for the next few months.  Also, unemployment claims just last week were below 300,000 for the first time in several years.  This will lead to higher rates by the Federal Reserve in 2015. Credit markets that determine interest rates will not sit idly by waiting for the Federal Reserve to act the and as a result we could be seeing the last rally in rates before they turn upwards closer to 4.50% in the next few months and closer to 5.00% in 2015.

If you read Fortune Magazine (and the editor’s opinion) Andy Sewer thinks we are in a sweet spot of low inflation and increasing unemployment that will translate into a stronger US economy. He is a fan of the current administration, so personally I think he has an agenda, but his case of a growing economy is not totally unrealistic. Yes if you read the other popular financial magazine, Forbes, things do not looks so rosy.  I sit more in their camp and somewhere in the middle they are both right, which means a better growing economy. I do think we will hit better employment numbers and to most this means a rising Feds Fund Rate.

Rates if they do rise, and I think they will, generally rise very gradually.  We may have a week of headline news of impending higher rates but it is just to gain attention mostly. Rising rates will make Adjustable Rate options more attractive. Right now the spread between 30 year fixed and ARM rates make the fixed rates for most buyers the better choice. If you are borrowing 750k or more the long term ARM’s are a better play but again you have to be in that loan amount category for me to really suggest it is the better option.

Top Prediction – Rates will eventually go up.  This year is a pretty safe bet.  In order to offset just a 1% rise in rates a buyer has to spend MORE than 10% less just to keep the same principal and interest monthly payment.

Example:

$500,000 Loan – 4% interest – 30 years  = $2387 payment

$450,000 Loan – 5% interest – 30 years = $2,415 payment

Final Analysis

  • The fall market usually results in an 18% rise in inventory and similarly a 20% rise in buyer sales.  (versus spring, which is much higher for both)
  • Threat of interest rate hikes will likely cause some buyers to get off the fence and buy this fall
  • Multiple offers on the best priced homes will rise
  • Short sale and foreclosure home inventory will continue to drop
  • Prices will stay the same or slightly drop (less than 5%) due to inventory levels for most areas of the Outer Banks
  • Price reductions will continue to be the main tool used to get most homes sold, keeping the average days on market high
  • To beat the curve, price your home 5% to 10% below market value to entice multiple offers (driving up the price) and to sell quickly, avoiding the price reduction method of selling as well as further out of pocket costs
  • Rental income will continue to be strong and will support roughly 75% of the expenses of owning  (for most homes)

My goal is to always provide unbiased information to every prospective buyer and seller.  I want you to have the FULL PICTURE of the market today so that the best decision for you and your family can be made.  I hope you got a lot out of this report.  I know I learned a lot in putting it together.

If you have questions about buying or selling on the Outer Banks, I hope you’ll contact me to assist you in that endeavor.

Outer Banks Marathon

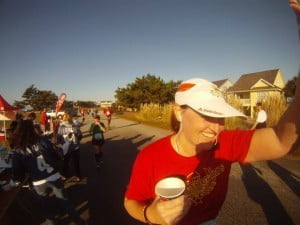
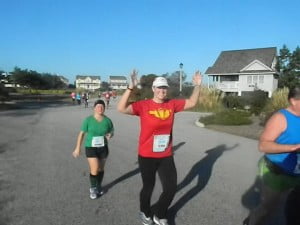
Marathon weekend has now come and gone.  Boy was it an event.  It started off with a Saturday wake up call to a very sick Charlie.  I was scheduled to run the 5k at 10 am.  Needless to say that didn’t happen.  I was starting to worry that he would not be well enough for me to leave him on Sunday morning to run the half.  It’s so interesting because a week ago, I was wondering if I even still wanted to do it.  Then at the thought of not being able to go got me all worked up.  Of course my first priority is Charlie.  But I realized Saturday morning that I actually wanted to run this race.  I hadn’t felt like that much at all during this whole process.  It was a very strange feeling.

Saturday night I actually went to bed early and slept well all night.  I set my alarm for 5 am but ended up waking up around 4:30.  Not seeing much reason to go back to sleep I decided I would just get up.  I went down to check on Charlie and he was actually doing well.  He gave me the green light to go ahead and make the journey.  So I set off to pick up Lisa and head to Nags Head.  Once we got to the Dream Center…where the event begins…I wasn’t extremely nervous.  I had a few butterflies but was so in awe of the number of people around.  Hugs, well wishes and laughs going on all around you has a much needed positive effect on the nerves.

The plan was to run with Lisa for a few miles and then just get in our own groove and do our thing.  Run our own race, as Matt put it.  We heard the gun go off for the first corral.  That’s a fitting term for it as we were literally corralled like livestock to the front as each group was given the green light to start their race.  It got to be our turn to start and from the beginning my legs didn’t feel quite right.  This isn’t unusual as I am a slow “starter-upper” when it comes to running.  I find it takes about 2.5 miles to get into my groove.  My legs felt like lead.  We started off very slowly.  Lisa and I kept pace for about the first mile.  Even though my legs never did warm up, around mile 2 things got just a tad easier.  I was looking forward to mile 6 as I knew once there it would be easier.

What I found at mile 6 was the Brindley Beach water booth, the “easier” part I was hoping for never did show up.  That Brindley booth was a needed sight as many of them are also Bootcampers.  The cheering and encouragement was much appreciated at that point.  I knew I was nearly halfway.  However, my hips said, halfway?  You’ve got to be kidding, we’re done!  By then most everything else is blurry until Mile 11.  I do remember a brief holler from the Beach Realty water table at Mile 9 or 10.  Then the bridge!  Oh the bridge.  By this time I was fighting the pain with everything in me.  Fighting the hip pain so much that my shoulder muscles got so tense it almost replaced the pain in my hip.  Shaking out my arms, shrugging my shoulders, I boldly took on the bridge.  Within a few steps I knew it.  I knew I needed to walk it.  My feet were numb, shoulders screaming, hip burning, I just needed the small break.  At the top of the bridge, no excuses, it’s all downhill I have to run it.  So I did.  Hit the next water station, got up about a half mile and who finds me?  Thing 2!

Re caught up with me and just as I was about to take off on another jog, she said she needed to walk a bit.  I was certainly not going to argue with her!  So we made the pact to walk for mile 11 and pick up the jog at 12 all the way in.  It’s been suggested many times by Adam that throughout our training we take part in an ICE BATH.  I’ve never been brave enough to try it.  At mile 11.5, I was begging for one!  This is how I knew what trouble I would be in, if I finished this thing.  Re kept assuring me we would finish, even if we were crawling!  I believed her, knowing she would drag me behind her if she had to! That’s what “Things” do for each other!

About mile 11.75, I start proclaiming with every ounce of determination I had that I would NEVER, EVER, EVER do this again!  Why in the world did I agree to do this?  People who do this are just plain crazy.  I’ve done one and I’m not doing another.  Of course at this point I’m not even finished yet…Oh dear!  So mile 12 is upon us.  We take off in a jog.  Re says she has to stop again.  I knew darn well she wouldn’t for good!  I’m jogging away in all the pain thinking to myself, less than a mile…you just have to go less than a mile.  A little ways down I knew I had to be half a mile out.  I kept saying, just a half a mile, you can do it, half a mile.  Then to the corner off the main road onto the side roads a lady yells out “Only a quarter mile to go!”  Oh dear God, I’m so close.  I keep saying to myself, only a quarter of a mile, quarter of a mile.  Then another turn with people yelling “You’re almost there!”  I chant to myself, I’m almost there.  Last left turn ahead I hear the most beautiful words…”Just this left turn and you’re done!”  I start saying left turn, left turn, that’s it…that’s all you have to do.

I get to this left turn and see a HUGE crowd of people standing and cheering.  It’s absolutely overwhelming.  The cheers are streaming in, you hear your name called by a few familiar faces.  I couldn’t tell you who they are right now because I had tears in my eyes.  I had to fight back the emotion as I was about to completely break down.  I look down, gather my composure, look back up to see the FINISH and a few strays in front of me who had passed me at the last minute.  I take off in a sprint, despite the excruciating pain, pass 3 of the 4 and straight into the arms of Jay.  Oh, I love this man, yet have never before been so happy to see him.  It meant I had done it.  I had run 13.1 miles (well about 11.5 of them.)  I finished this monumental task and started crying.  More hugs from Jessica and Joan then I get out of the way to wait for Re.  I see her…she comes in strong.  First thing out of her mouth….Jay said drink Pineapple Juice.  Ha Ha…ok, let’s find the pineapple juice.

On the way home it occurred to me that I had just finished all that running, had burned all those calories and was hungry.  I’m having a BURGER, I exclaim.  And so I did.  It was the best burger I’ve had in a very long time.  Still proclaiming I’m never doing this again all the way home.  The next day I review the results.  I see my time.  2:46. I know I can do better than this.  After all the full marathon winner beat me by more than 20 minutes.  What? I can’t possibly go down like that!  This can’t be the best I can do.  Ok, when does training start for the Flying Pirate half in April?  Yes…I’m hooked.  I suppose there are worse things to be hooked to than running.  I’ll take it!  In April I will finish in 2 hours.

That’s the new goal.

Get your Pirate on!

Pirates were one of the realities that merchants along the Outer Banks had to deal with throughout the late 1600’s and early 1700s.  Pirates attacked and raided Spanish and British ships carrying gold, silver and other riches. They used the outer Banks as an escape and to store their loot.  Blackbeard also known as Edward Teach lived in Ocracoke until November 22, 1718 when the British Royal Navy cornered him.  Blackbeard went down fighting instead of surrendering.

In the Outer Banks we have had several famous pirates such as Anne Bonny, Calico and Pamlico Jack, Mary Read, and Stede Bonnet. 

The Outer Banks Pirate Festival will kick-off on Thursday, September 13 and carry on with festivities on Outer Banks until ending on Saturday, September 15. Discover Pirate history and everything Pirate from a Scallywag School for Young Scoundrels, how to use pirate weapons, storytelling, and pictures and more with pirates, pirates everywhere! 

The event kicks on Thursday with a treasure hunt that begins at Kitty Hawk Kites and continues with a search through the stores of Jockey’s Ridge. 

Get ready to get your Pirate on… Argh, Mateys!

For more information go to:  Outer Banks Pirate Festival