NEEDS vs WANTS
- Needs – UpDATES; maintenance
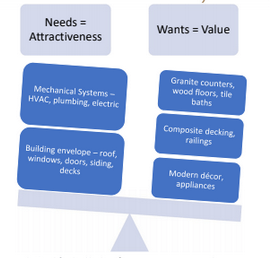
items that increase attractiveness,
peace of mind, and cause home to sell
faster - Wants – UpGRADES that may
increase VALUE AND make a home
sell faster; appeal

Remember, not all Upgrades make sense! Let’s talk before you spend –
sometimes money is better spent adjusting price vs. investing more in the
home.