Getting an offer on your home in an active market seems quite easy, and in most cases it is. What do you need an agent for then? Well, finding the buyer is just the first of dozens of steps in getting your home sold.
The question becomes, do you want to ensure you are getting maximum VALUE as well as maximum CONVENIENCE when selling? It’s actually a pretty pain staking process to go through the entire 45 to 60 day process and requires many, many hours of time.
Many sellers think they can get an offer and then “let the attorney handle it”. Yes, your attorney can manage the CLOSING. That simply entails preparing your deed and handling the transfer of money AT THE END OF THE TRANSACTION.
Here’s what it doesn’t include:
- Pre-Qualifying the buyer/agent/offer to make sure it’s a solid deal
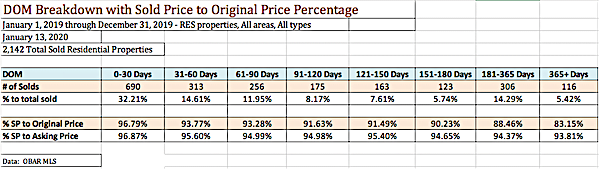
- Negotiating for the highest dollar
- Choosing the best offer, in the case of multiple offers (it’s not always about the highest price)
- Negotiating the home inspection, including finding contractors to give estimates, and meeting them at the home
- Pest Inspection, Septic Inspection, Pool/Hot Tub, HVAC – knowing vendors and meeting them at the home
- Prepping the appraiser or answering comparable questions – attorneys don’t have access to MLS, nor have been in the latest homes sold
- Staying on top of the buyer’s loan process
- Knowing which lenders and other vendors perform on time
- Working with the rental company to transition buyer
- Handling the dozens of calls from buyer/buyer’s agent throughout the process
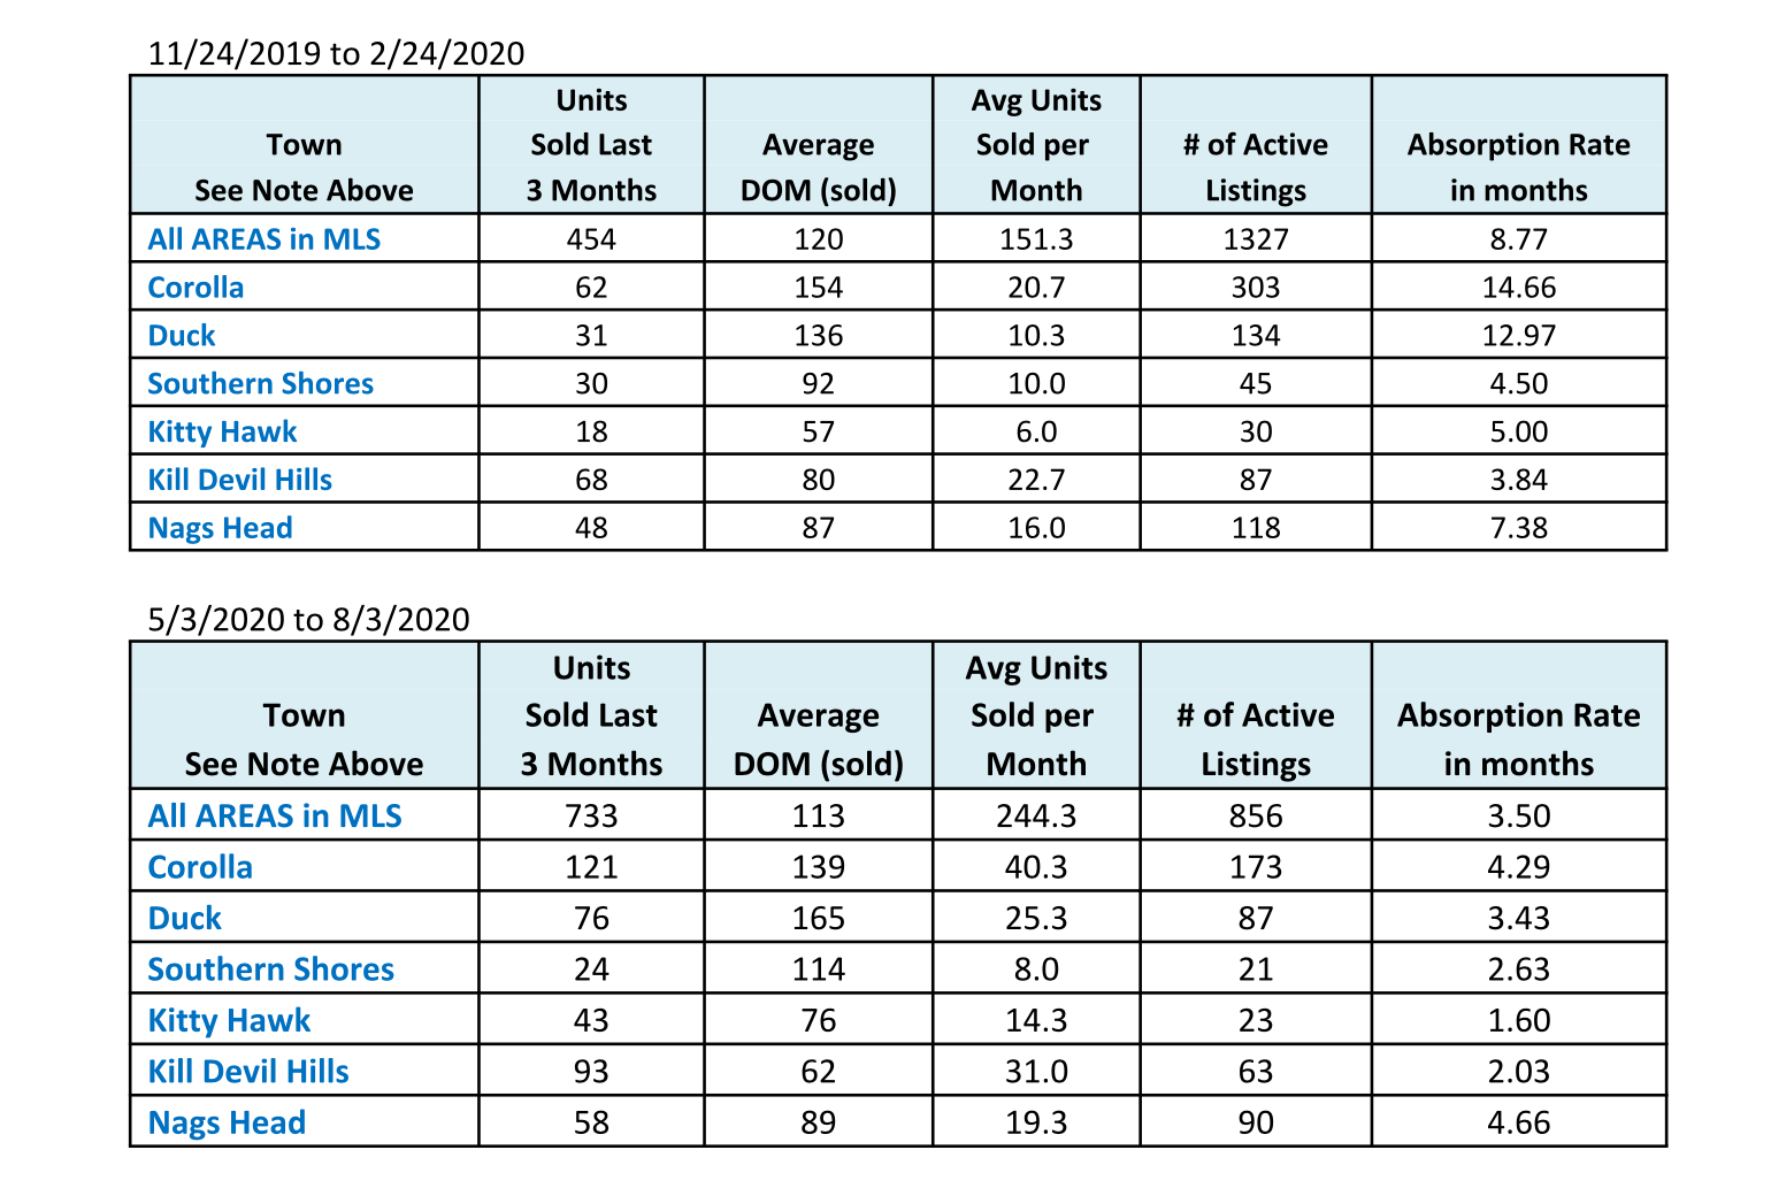
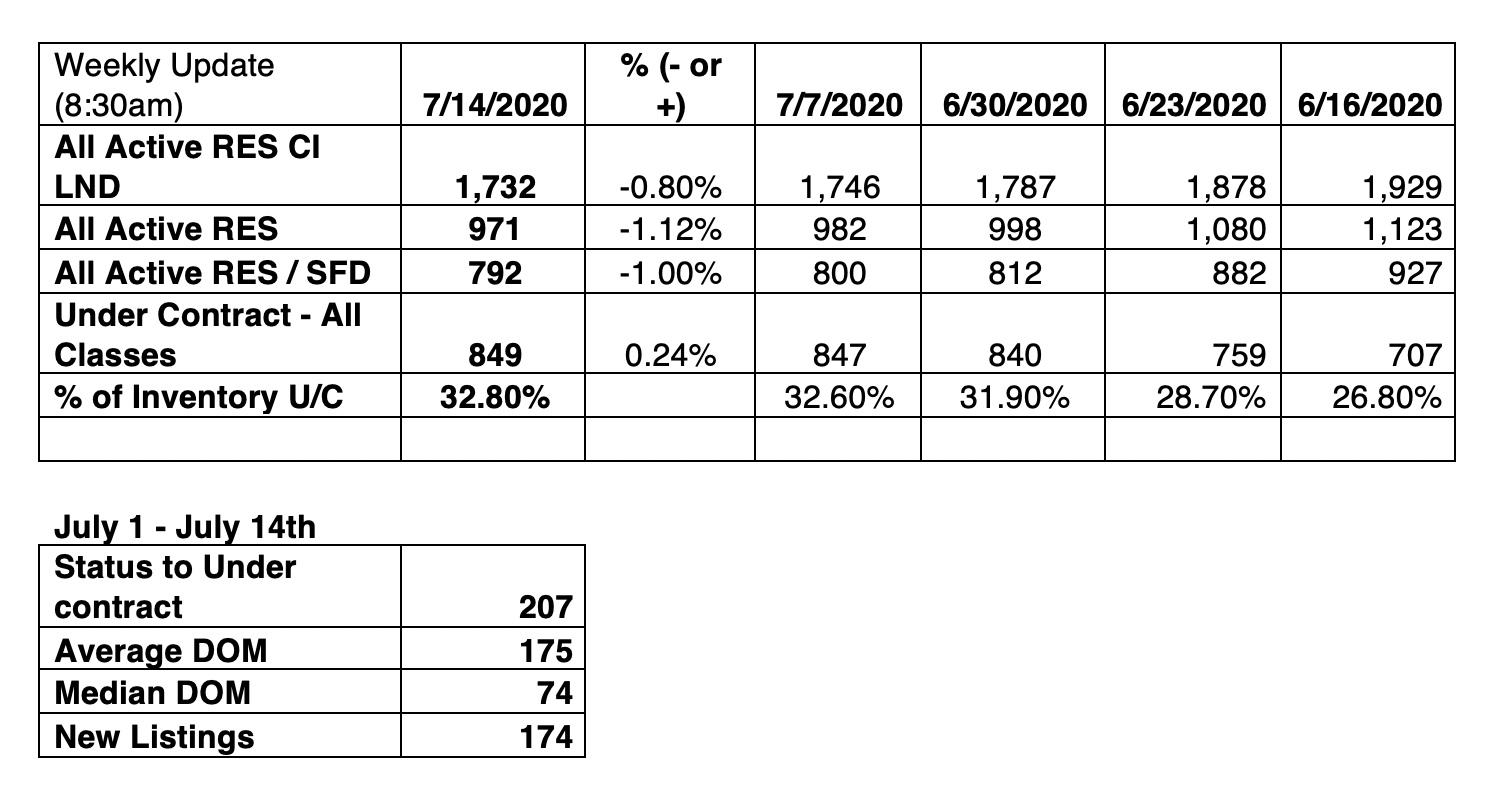
Bottom line, we are experiencing an extreme number of homes selling per month. All requiring an attorney to manage the closing. The attorney is not available to answer calls throughout the day to deal with the day to day situations that come up during your closing process. In addition to that, if they were available, they would be charging you per hour for that time. Most attorneys charge around $200/hour. On average an agent will spend 30 to 40 hours working on your transaction.
Even if you offer a commission to a Buyer’s Agent and think they can assist with these tasks, that’s true. However, the Buyer’s Agent works for the buyer. You are now essentially paying the buyer’s agent to work AGAINST you, without your own representation.
In the end, the best way to maximize VALUE and CONVENIENCE is to have a professional agent manage the ever challenging task of getting your home sale to a successful closing.