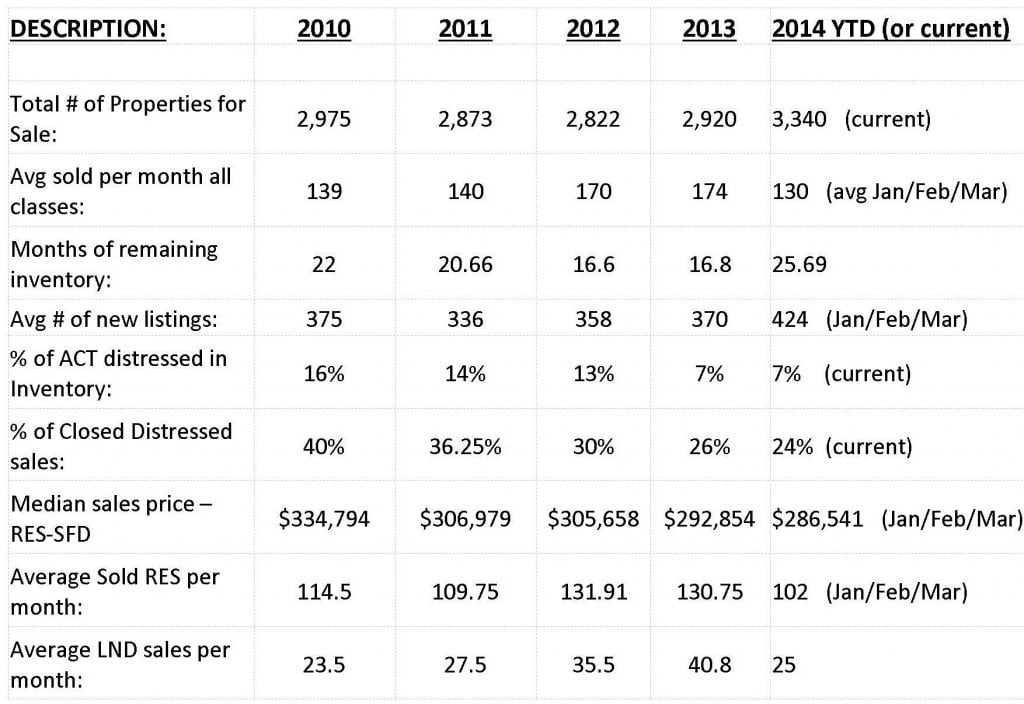
Statistics provided for years 2010 through 2013 represent the December year-end figures
Rev. – April 8, 2014
Basically this chart shows us that inventory is up, number of sales are down as is the median sales price. While it’s pretty early to get too concerned, it’s definitely something to keep an eye on. In most cycles, being at the “bottom of the market” doesn’t mean we shoot straight up right away. While I still think recovery is on the horizon, it’s not uncommon to have a blip or two along the way. Be prepared for a sluggish year. This is not to say we can’t get homes sold, we just have to be very proactive with our strategy.
Also be aware if you are buying this year, you may see a temporary dip in value. In long term ownership this is nothing to be concerned about.


